Normal-distribution-statistics-based bus power balance analysis method

An analysis method, the technique of normal distribution, applied in the field of analysis

Inactive Publication Date: 2015-11-18
CHINA ELECTRIC POWER RES INST +2
View PDF0 Cites 5 Cited by
  • Summary
  • Abstract
  • Description
  • Claims
  • Application Information

AI Technical Summary

Problems solved by technology

[0004] Aiming at the deficiency of judging the unbalanced amount of busbar power under a single time section, the present invention provides a busbar power balance analysis method based on normal distribution statistics. Carry out evaluation to improve the accuracy and practicability of bus power balance assessment

Method used


Image

  • Normal-distribution-statistics-based bus power balance analysis method
  • Normal-distribution-statistics-based bus power balance analysis method
  • Normal-distribution-statistics-based bus power balance analysis method

Examples


Embodiment Construction

[0036] The present invention will be described in further detail below in conjunction with the accompanying drawings.

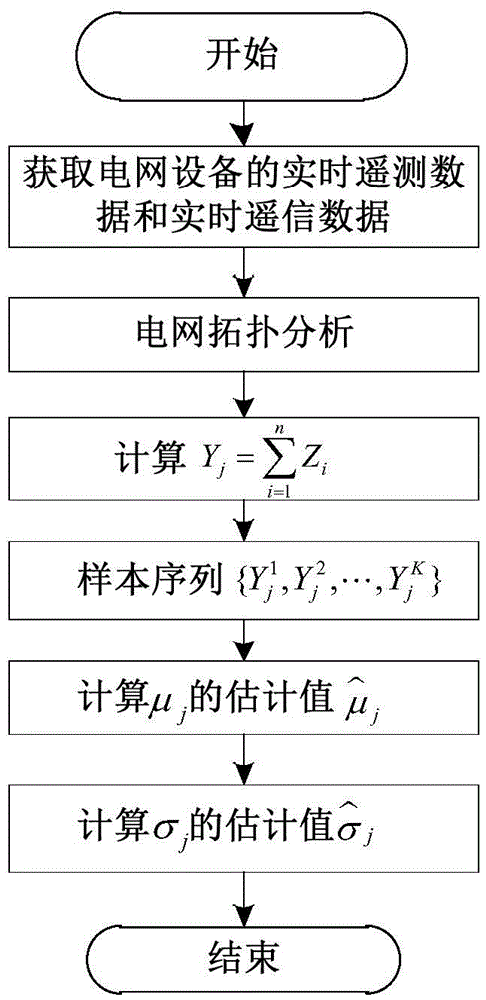
[0037] The present invention provides a bus power balance analysis method based on normal distribution statistics, such as figure 1 , the method includes the following steps:

[0038] Step 1: Obtain real-time telemetry data and real-time telesignaling data, and conduct power grid topology analysis;

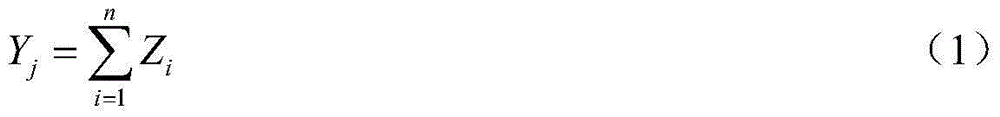
[0039] Step 2: Calculate the unbalanced power of the busbar under a single time section;

[0040] Step 3: Carry out mathematical statistics on the bus power unbalance under multiple time sections;

[0041] Step 4: Evaluate the balance of bus power based on the estimated value of the population mean and the estimated value of the population standard deviation.

[0042] Described step 1 specifically comprises the following steps:

[0043] Step 1-1: Obtain real-time telemetry data and real-time telesignaling data of power grid equipment from the data acquisition...


PUM


Abstract

The invention provides a normal-distribution-statistics-based bus power balance analysis method. The method comprises the following steps: obtaining real-time telemetering data and real-time remote signaling data and carrying out a topological analysis of a power grid; calculating a bus power unbalance amount under a single time section; carrying out mathematical statistics on bus power unbalance amounts under multiple time sections; and evaluating a balance of a bus power according to an estimation value of a population mean and an estimation value of population standard deviation. According to the invention, in order to overcome a defect of bus power unbalance judgment under a single time section, the unbalance amount of the bus power is used as the random variable meeting the normal population distribution, the mathematical statistics analysis is carried out on the bus power unbalance amount of the calculated bus, and the balance of the bus power is evaluated from the perspective of the population mean and the population standard deviation by using the random-variable-based mathematical statistics theory, thereby reflecting problems of data measurement and thus improving accuracy and practicability of the bus power balance examination.

Description

technical field [0001] The invention relates to an analysis method, in particular to a bus power balance analysis method based on normal distribution statistics. Background technique [0002] The basic data of the smart grid dispatching control automation system mainly includes measurement data collected by SCADA, static data manually input such as system generator sets, transformers and line parameters, and planning data. The quality of the basic data of the power system is an important factor affecting the practical application level of the smart grid dispatching control system. Its accuracy not only affects the calculation accuracy of the state estimation of the power system, but also is the basis for the advanced application software of the system-wide intelligent control system. [0003] At present, the evaluation of the quality of basic data is mainly carried out from two perspectives: measurement data and state estimation results. Because the evaluation of state esti...

Claims


Application Information

Patent Timeline
Patent Type & Authority Applications(China)
IPC IPC(8): G06Q50/06
Inventor 王淼王磊黄文英常乃超宋旭日郎燕生马晓忱陈雪净刘金波林静怀陈郑平张振
Owner CHINA ELECTRIC POWER RES INST
Why Eureka
Try Eureka