Multi-sample detection device and method
A detection device and detection method technology, applied in the direction of color/spectral characteristic measurement, etc., can solve the problems of unfavorable mass sample testing, unfavorable sample testing market development, low experimental efficiency, etc., and meet the requirements of fast and accurate sensitivity and meet the sensitivity requirements. , the effect of improving the accuracy
- Summary
- Abstract
- Description
- Claims
- Application Information
AI Technical Summary
Problems solved by technology
Method used
Image
Examples
Embodiment 1
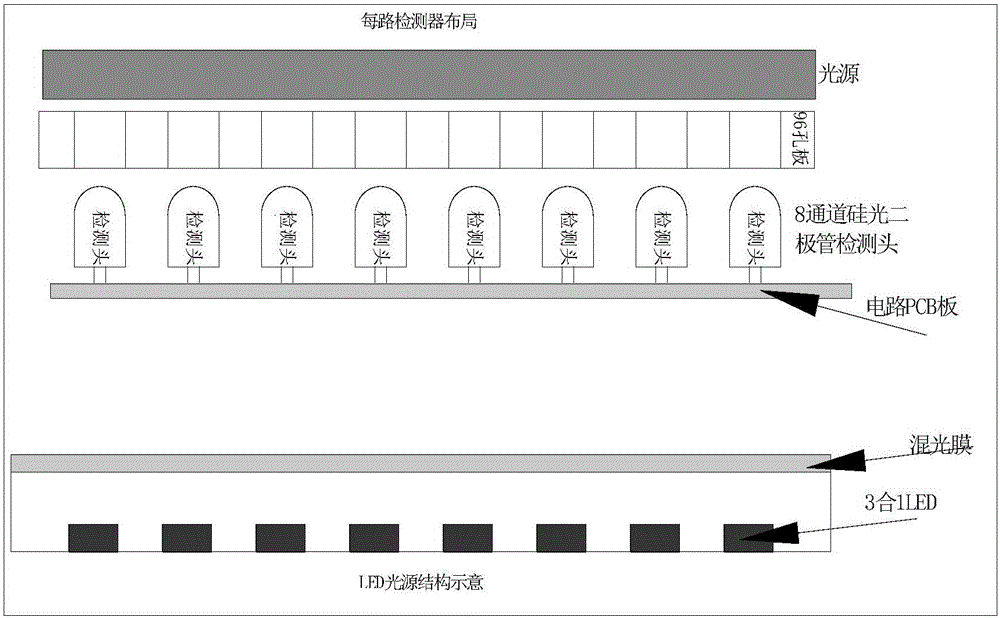
[0084] like figure 1 Shown is the schematic cross-sectional structure of the multi-sample detection device. As shown in the figure, the light source and the data acquisition plate are located on both sides of the 96-sample well plate, and the sample well plate is provided with a plurality of sample wells arranged in rows and columns, as shown in the figure. It is a row of a 96-well plate, in which the light source structure includes a light mixing film and a 3-in-1 LED. The light source illuminates multiple sample wells in a row at a time, and the 8-channel silicon photodiode PD on the data acquisition board (located on the PCB board in the figure) is generated by the light source. Detection head detection.
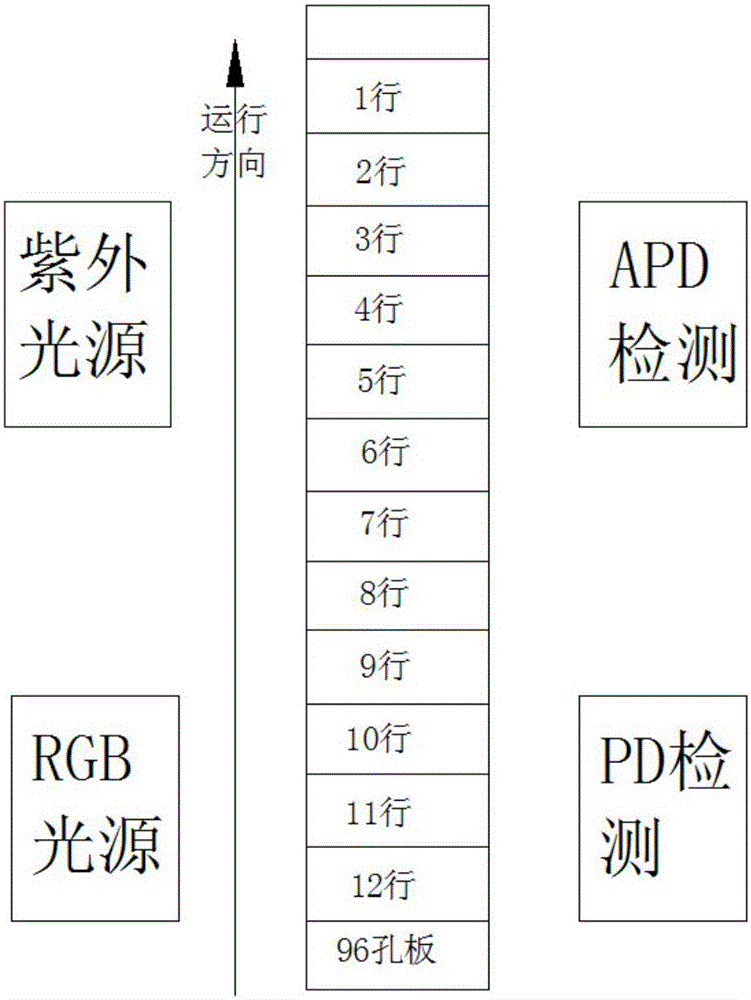
[0085] After the detection of one row is completed, the sample well plate can be moved relative to the light source and the data acquisition plate, so as to detect the samples in each row or all the sample wells of the sample well plate. The structure diagram of the sampl...
Embodiment 2
[0121] The detection data for a row of 8 sample wells are as follows:
[0122]
[0123] Now take a few representative rows of data as an example to illustrate:
[0124] Among them, 55AA58494AAC31090101FE00 is the instruction data area, and 0000 in the last line is the terminator.
[0125] The 8 sample well channels are illuminated by R, G, B three-color light sources in sequence, and the obtained data can be listed in the following table:
[0126] R
00 80
00 80
00 80
0F 80
00 80
00 80
00 80
00 80
G
00 80
00 80
00 80
00 80
00 80
00 80
02 80
00 80
B
03 80
06 80
0A 80
00 80
01 80
18 80
12 80
14 80
hole 1
hole 2
hole 3
hole 4
hole 5
hole 6
hole 7
hole 8
[0127] In addition, if the collected data is 0x0E80=0x000E=14, the actual data = the collected data - 0x8000, the highest bit of the data in the design is used...
Embodiment 3
[0155] Preferably, the method further includes the step of: restoring the color of the sample in each sample well according to the colorimetric value of the sample in each sample well in Example 2.
[0156] Image 6 It is the result of the software complex color display when the bacterial solution is just added to the reagent plate, Figure 7 It is the display result of the color restoration of the detected data by the software after 20 hours, Figure 8 Test plates for bacterial growth taken after 20 hours. Among them, the first column of data in the figure is turbidity, and the other columns are color information.
[0157] The data in each sample hole represents the numerical component of R|G|B, the red component is more red than other colors, the red and green components are both 255, and the blue component 0 is yellow.
[0158] Figure 7 The test data show that its Figure 8 The colors of the samples in the photographed bacterial growth test plate are the same, so the ...
PUM
 Abstract
Description
Claims
Application Information
 - R&D
- Intellectual Property
- Life Sciences
- Materials
- Tech Scout
- Unparalleled Data Quality
- Higher Quality Content
- 60% Fewer Hallucinations
Browse by: Latest US Patents, China's latest patents, Technical Efficacy Thesaurus, Application Domain, Technology Topic, Popular Technical Reports.
© 2025 PatSnap. All rights reserved.Legal|Privacy policy|Modern Slavery Act Transparency Statement|Sitemap|About US| Contact US: help@patsnap.com


