Near-infrared detection method for peanut quality and application
A technology for near-infrared detection and peanut quality, applied in measuring devices, material analysis through optical means, instruments, etc., can solve the problems of less prediction model reports, unclear spectral characteristic wavelengths, and more spectral redundant information
- Summary
- Abstract
- Description
- Claims
- Application Information
AI Technical Summary
Problems solved by technology
Method used
Image
Examples
Embodiment 1
[0096] Example 1: Near-infrared Detection of Coated Peanut Protein
[0097] 1) Collect a total of 150 samples of the covered peanut samples in the above table 1;
[0098] 2) Determining the protein content of the covered peanut sample collected in step 1), the basic statistical data are shown in Table 3;
[0099] Table 3 The basic statistical data of the protein content of the coated peanut
[0100] Average (%)
Maximum (%)
Minimum value (%)
standard deviation
22.24
24.85
18.41
1.01
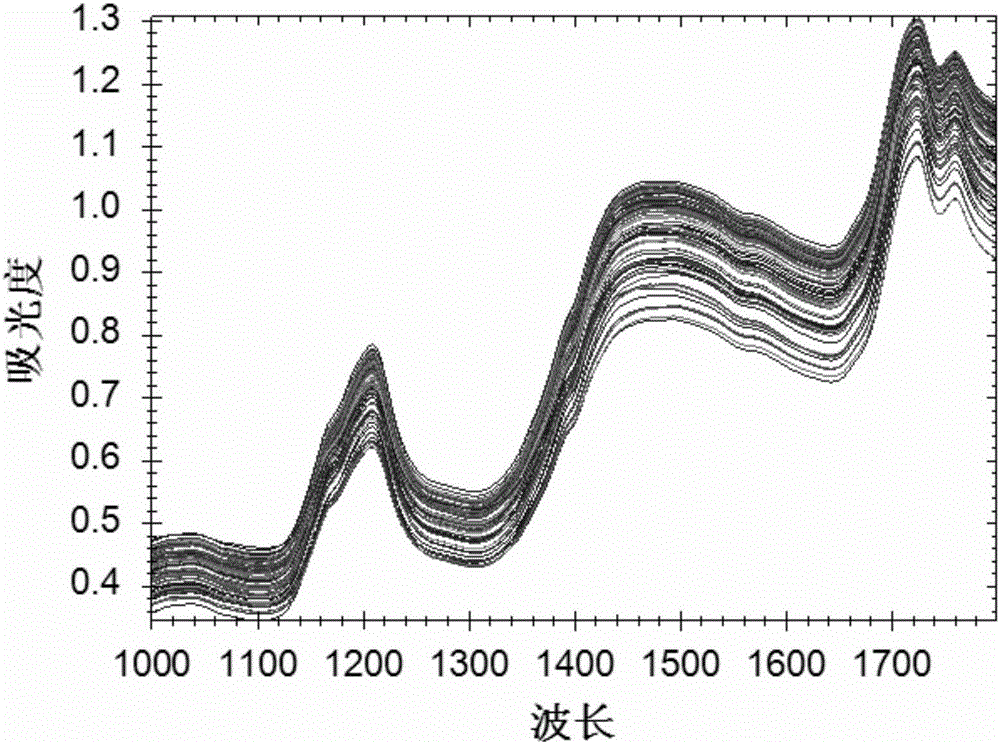
[0101] 3) Carry out near-infrared scanning to the peanut sample collected in step 1), the original spectrum is shown in the attached figure 1 ;
[0102] 4) For the absorbance value x obtained in step 3) ij Carry out denoising processing and preprocessing: use wavelet denoising method to x ij Perform denoising processing to obtain the denoising absorbance value, and then perform orthogonal signal correction (OSC) preprocessing on the denoising abs...
Embodiment 2
[0116] Example 2: Near-infrared Detection of Moisture in Coated Peanuts
[0117] 1) Collect a total of 150 samples of the covered peanut samples in the above table 1;
[0118] 2) Determining the moisture content of the coated peanut samples collected in step 1), the basic statistical data are shown in Table 4.
[0119] Table 4 Basic statistical data of moisture content of peanuts with coats
[0120] Average (%)
Maximum (%)
Minimum value (%)
standard deviation
5.48
5.69
5.21
0.11
[0121] 3) Carry out near-infrared scanning to the peanut sample collected in step 1), the original spectrum is shown in the attached figure 1 ;
[0122] 4) For the absorbance value x obtained in step 3) ij Perform denoising and preprocessing: use the threshold denoising method to x ij Perform denoising processing to obtain the denoising absorbance value, and then perform first-order derivative preprocessing on the denoising absorbance value to obtai...
Embodiment 3
[0137] Example 3: Near-infrared detection of peanut fat with coat
[0138] 1) Collect a total of 150 samples of the covered peanut samples in the above table 1;
[0139] 2) Determining the fat content of the coated peanut samples collected in step 1), the basic statistical data are shown in Table 6.
[0140] Table 6 Basic statistical data of fat content of peanuts with coat
[0141] Average (%)
Maximum (%)
Minimum value (%)
standard deviation
49.75
52.52
48.45
0.84
[0142] 3) Carry out near-infrared scanning to the peanut sample collected in step 1), the original spectrum is shown in the attached figure 1 ;
[0143] 4) For the absorbance value x obtained in step 3) ij Perform denoising and preprocessing: use the threshold denoising method to x ij Perform denoising processing to obtain the denoising absorbance value, and then perform standard normalization and multivariate scattering correction preprocessing on the denoising ...
PUM
 Abstract
Description
Claims
Application Information
 - R&D
- Intellectual Property
- Life Sciences
- Materials
- Tech Scout
- Unparalleled Data Quality
- Higher Quality Content
- 60% Fewer Hallucinations
Browse by: Latest US Patents, China's latest patents, Technical Efficacy Thesaurus, Application Domain, Technology Topic, Popular Technical Reports.
© 2025 PatSnap. All rights reserved.Legal|Privacy policy|Modern Slavery Act Transparency Statement|Sitemap|About US| Contact US: help@patsnap.com


