

Network threat evaluation method based on multi-granularity anomaly detection
An anomaly detection, multi-granularity technology, applied in the field of network security, can solve the problem of not being able to adapt well to quickly and accurately identify attack events, perceive threat situation, etc., to ensure safe use and use effects, huge economic and social benefits, and stable methods. reliable results
- Summary
- Abstract
- Description
- Claims
- Application Information
AI Technical Summary
Problems solved by technology
Method used
Image

Examples
Embodiment Construction
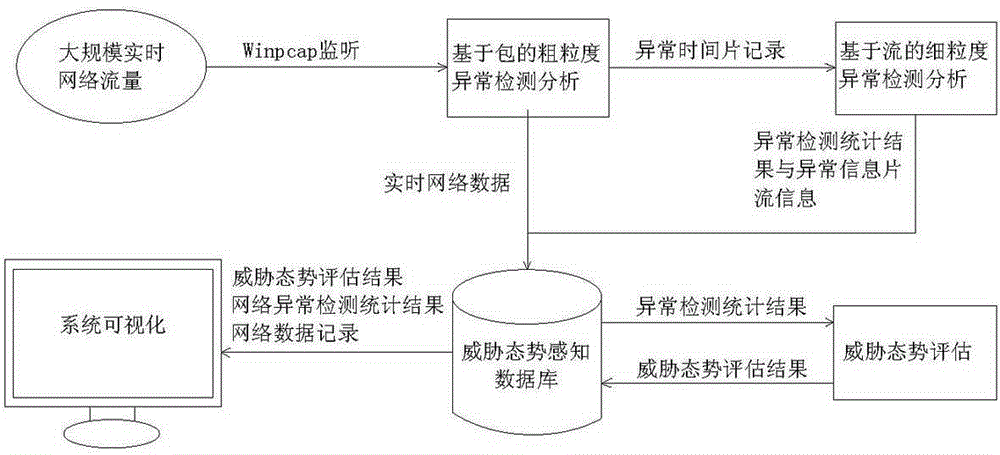
[0012] The specific implementation manners of the present invention will be described in detail below in conjunction with the accompanying drawings and specific conditions.
[0013] In the specific implementation of the present invention, firstly, the packet-based coarse-grained anomaly detection is used to analyze the time slices containing abnormal network traffic; and then, through the flow-based fine-grained anomaly detection, the network traffic of abnormal time slices is stream recombined and extracted Flow feature attributes, using the flow feature anomaly detection algorithm to determine the attack type; finally, for the detected threat events, quantitatively evaluate the severity of the current network threat, which is specifically implemented by the following steps:
[0014] 1. Package-based coarse-grained anomaly detection:
[0015] 1. Online monitoring of data traffic in the real-time network environment, and store it according to the time window of 1 minute, and u...
PUM
 Abstract
Description
Claims
Application Information