Two-phase flow pressure drop and noise spectrum analysis-based flow pattern discrimination method and system thereof
A technology of frequency spectrum analysis and discrimination method, which is applied in the field of flow pattern discrimination method and its system based on two-phase flow pressure drop noise spectrum analysis, can solve the problems of no recognition rule and rough recognition effect, and achieve light weight and structure The effect of simplicity, size and power consumption
- Summary
- Abstract
- Description
- Claims
- Application Information
AI Technical Summary
Problems solved by technology
Method used
Image
Examples
Embodiment 1
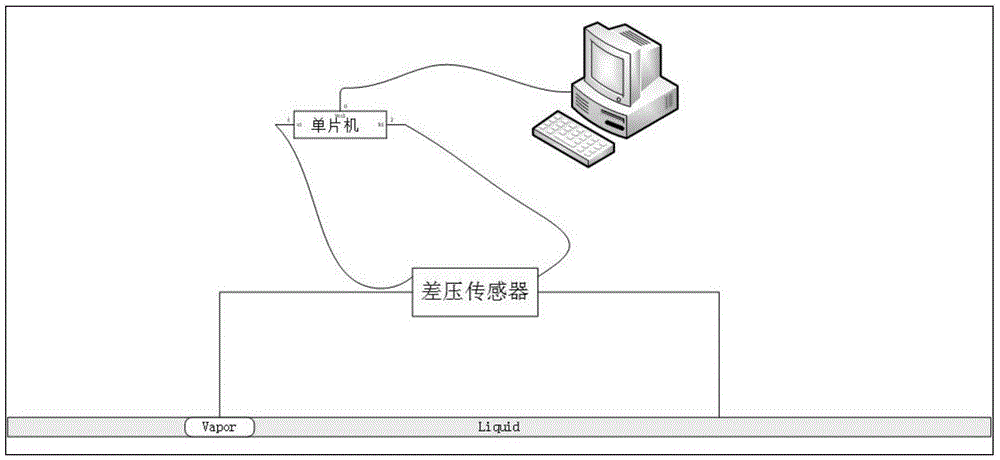
[0076] The flow pattern discrimination method based on the two-phase flow pressure drop noise spectrum analysis of the present invention comprises the following steps:
[0077] Step 1: Collect the corresponding continuous pressure drop time-domain signals at both ends of the pipeline measurement section and at both ends of the liquid pump respectively;
[0078] Step 2: performing high-frequency sampling on the continuous voltage drop time-domain signal to obtain a voltage drop time-domain diagram;
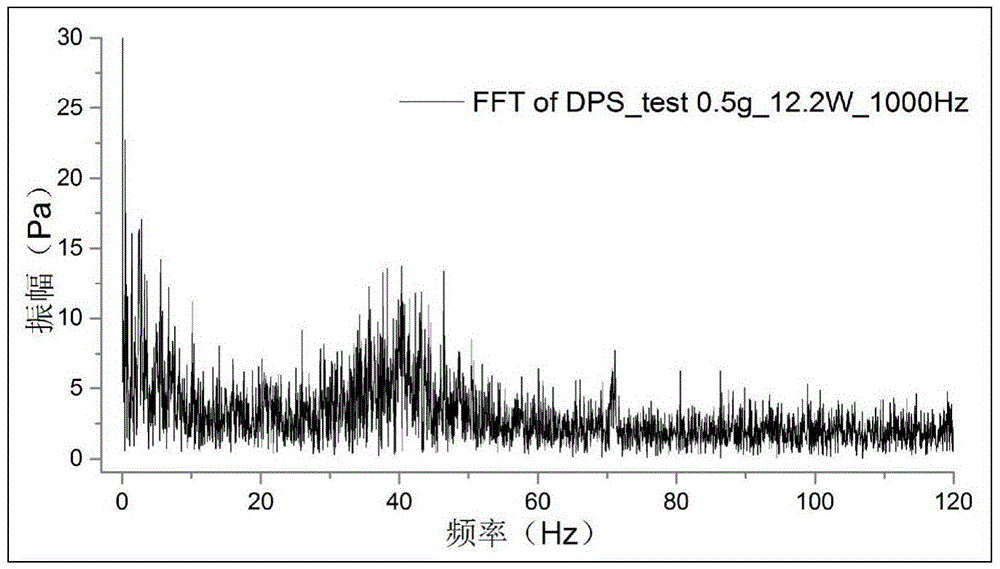
[0079] Step 3: transforming the pressure drop time-domain map into a pressure drop spectrogram by using Fast Fourier Transform;
[0080] Step 4: Correlation judgment is made between the pressure drop spectrum diagram at both ends of the pipeline measurement section and the pressure drop spectrum diagram at both ends of the liquid pump, and the category of the two-phase flow is obtained.
[0081] Wherein, if the pressure drop spectrogram corresponding to the pipeline measurement se...
Embodiment 2
[0126] The water-nitrogen mixed working fluid two-phase pipeline has an inner diameter of 2mm, and the driving force source is air pressure. Schematic see Figure 8 .
[0127] Select the working condition of slug flow, and make an analog square wave signal diagram related only to the acceleration pressure drop according to the flow process captured by the high-speed camera. Fourier transform, compare the spectrogram of the experimental pressure drop sampling data, the results are as follows Figure 9 shown.
[0128]
[0129] Form three
[0130] Figure 9 Table 4 shows that the simulated square wave signal spectrum and the experimental pressure drop data spectrum have similar two characteristic noises in the low frequency band, so it can be proved that in the non-pump flooding experimental pipeline, the influence of accelerated pressure drop is also reflected in the pressure drop spectrum In the low-frequency band, the flow pattern can also be preliminarily judged by de...
PUM
 Abstract
Description
Claims
Application Information
 - R&D
- Intellectual Property
- Life Sciences
- Materials
- Tech Scout
- Unparalleled Data Quality
- Higher Quality Content
- 60% Fewer Hallucinations
Browse by: Latest US Patents, China's latest patents, Technical Efficacy Thesaurus, Application Domain, Technology Topic, Popular Technical Reports.
© 2025 PatSnap. All rights reserved.Legal|Privacy policy|Modern Slavery Act Transparency Statement|Sitemap|About US| Contact US: help@patsnap.com


