Fault diagnosis method during industrial process

A fault diagnosis and industrial process technology, applied in the direction of instruments, test/monitoring control systems, control/regulation systems, etc., can solve problems such as inability to guarantee the accuracy of diagnostic results, difficulty in obtaining them, pollution, etc.

Inactive Publication Date: 2016-06-22
HUAZHONG UNIV OF SCI & TECH
View PDF7 Cites 46 Cited by
  • Summary
  • Abstract
  • Description
  • Claims
  • Application Information

AI Technical Summary

Problems solved by technology

[0003] The fault diagnosis methods in the prior art include the fault diagnosis method based on the contribution graph and the fault diagnosis method based on the reconstruction; the fault diagnosis method based on the contribution graph considers that the variable that has the greatest contribution to the fault detection index is the variable that is most likely to fail, The accuracy of the diagnostic results cannot be guaranteed
The fault diagnosis method based on reconstruction needs to know the set of all possible fault directions in advance. When the correct fault direction is used for reconstruction, the influence of fault variables on the detection index will be eliminated, and the reconstruction detection index will also return to the control limit. This method belongs to the supervision-based method, and its limitation is that it needs to know the prior information of all possible fault directions in advance, which is difficult to obtain in some industrial processes
[0004] Existing fault diagnosis methods based on contribution graphs and reconstruction-based fault diagnosis methods both have "pollution effects", and fault variables "contaminate" the influence of detection indicators on non-fault variables, making non-fault variables also have abnormal Contribution value, exceeding its control limit and causing misjudgment

Method used


Image

  • Fault diagnosis method during industrial process
  • Fault diagnosis method during industrial process
  • Fault diagnosis method during industrial process

Examples


Embodiment 1

[0092] In embodiment 1, the Monte Carlo (MonteCarlo) numerical simulation instance is specifically described as:

[0093] x * = x 1 x 2 x 3 x 4 x 5 x 6 = - 0.1681 0.2870 - 0.2...

Embodiment 2

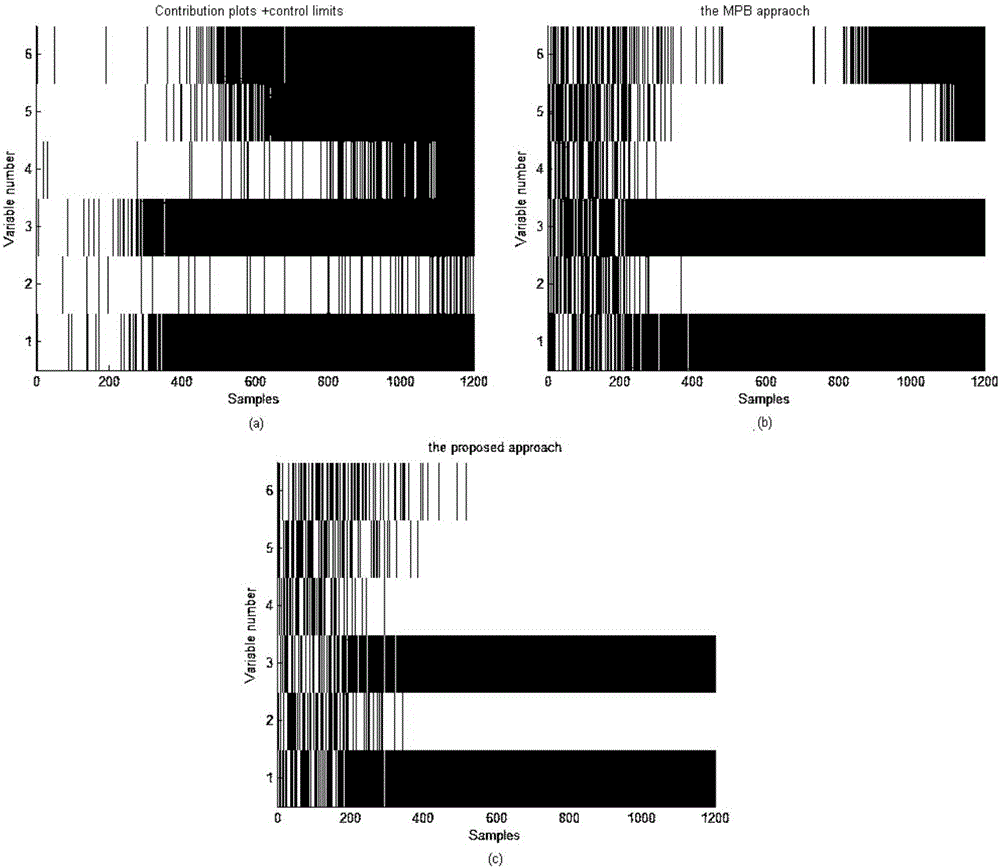
[0108] Embodiment 2 adopts the same training set of 3000 normal samples as in Embodiment 1, and changes the fault direction vector and fault amplitude of the fault samples to be tested, namely ξ 4 =[000100] T , f 4 =10 -5 ×q 2 , (q=1,2,...1000), a total of 1000 fault samples to be tested are generated. The specific process of carrying out fault diagnosis to embodiment 2 is the same as embodiment 1, image 3 (a), image 3 (b), image 3 (c) respectively shows the diagnosis results of the contribution graph method, the method based on the maximum a posteriori probability and the fault diagnosis method provided by the present invention in Embodiment 2.

[0109] Figure 4 (a) and Figure 4 (b) shows the different fluctuation ranges of the feature value when the process variable is selected by the reconstruction contribution value and the relative reconstruction contribution value respectively; Figure 4 (a) is the nRBC i (x t ) as a feature quantity, the value of the fea...


PUM


Abstract

The invention discloses a fault diagnosis method during the industrial process. The method comprises the steps of collecting historical normal data during the industrial process; calculating a detection statistics based on the historical normal data during the industrial process; collecting the to-be-detected data of the industrial process; on the condition that the industrial process is detected to be out of order, extracting a statistic feature based on the relative refactoring contribution method; according to the statistic feature, calculating a conditional probability density function in the fault mode and a conditional probability density function in the normal mode; according to the prior probability and the conditional probability density function, calculating a posterior probability; conducting the fault variable recognition on a current time sample based on the minimum risk Bayesian decision theory; according to a diagnosis result, updating the prior probability for the next time sample and conducting the fault diagnosis and recognition again for the next round. According to the technical scheme of the invention, the major failure variable, the secondary process variable and the normal variable of the current sample are distinguished. Meanwhile, the diagnosis result of the process variable of the previous time sample is applied to the diagnosis of the current sample. Therefore, the pollution effect during the fault diagnosis of the industrial process is eliminated.

Description

technical field [0001] The invention belongs to the technical field of industrial process fault diagnosis and identification, and more specifically relates to a method for industrial process fault diagnosis. Background technique [0002] Effective monitoring and rapid diagnosis of faults in industrial processes are of great significance to ensure a safe and reliable production environment with guaranteed quality and quantity. At present, the most widely used data-driven technology in industrial processes is multivariate statistical process monitoring, based on principal component analysis (Principal Component Analysis, PCA) and partial least squares (Partial Least Squares, PLS) models, using the model's squared prediction error (SquaredPredictionError, SPE) statistics and HotellingT 2 Statistics are used as detection indicators for fault detection. [0003] The fault diagnosis methods in the prior art include the fault diagnosis method based on the contribution graph and t...

Claims


Application Information

Patent Timeline
Patent Type & Authority Applications(China)
IPC IPC(8): G05B23/02
CPCG05B23/024
Inventor 郑英毛思敏刘淑杰汪上晓
Owner HUAZHONG UNIV OF SCI & TECH
Why Eureka
Try Eureka