
City smart power grid panoramic information visual multidimensional display technology framework

A technology for smart grid and display technology, which is applied in the field of smart grid and can solve the problems of lack of visualization technology of smart grid.

Inactive Publication Date: 2016-09-07
ELECTRIC POWER RES INST STATE GRID JIANGXI ELECTRIC POWER CO +1
View PDF5 Cites 10 Cited by
  • Summary
  • Abstract
  • Description
  • Claims
  • Application Information

AI Technical Summary

Problems solved by technology

[0005] However, the above-mentioned smart grid visualization technology lacks a multi-dimensional display of panoramic information from the power generation side to the power consumption side, from optimal dispatching to power marketing, and online assessment of the low-carbon benefits of each sub-module

Method used


Image

  • City smart power grid panoramic information visual multidimensional display technology framework

Examples


Embodiment Construction

[0020] The present invention specifically implements the visualized multi-dimensional display of urban smart grid panorama information in Gongqingcheng, Jiangxi Province.

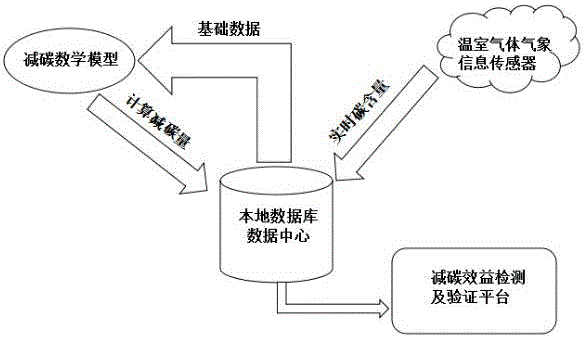
[0021] First build a unified information support platform, and then extract the comprehensive carbon reduction integrated into the unified information support platform from the power generation side, dispatching command, power distribution side, power consumption side and marketing, as well as the real-time atmospheric carbon reduction from the regional greenhouse gas monitoring weather station Make an integrated display and evaluate the low-carbon benefits of each sub-module online.

[0022] On this basis, the visual multi-dimensional display technology of urban smart grid panorama information is mainly divided into three layers. The bottom layer is a unified information support composed of related information collections from the power generation side, power grid side, power consumption side, environmental...


PUM


Abstract

The invention provides a city smart power grid panoramic information visual multidimensional display technology framework. The framework is constructed on the basis of a unified information support platform. Comprehensive carbon reduction of the aspect of the power generation side, scheduling command, the power distribution side, the power utilization side and marketing integrated on the unified information support platform and real-time atmospheric carbon reduction of a regional greenhouse gas monitoring meteorological station are extracted to be displayed in an integrated way so that the low carbon benefits of each submodule are assessed online, based on which visual multidimensional display of city smart power grid panoramic information can be realized. According to the city smart power grid panoramic information visual multidimensional display technology framework, the information of weather information, environmental information, carbon reduction, carbon emission, low carbon assessment benefits and clean energy access favorable for guiding and directing the public can be displayed in a centralized way so as to accept the supervision of the public.

Description

[0001] technical field [0002] The invention relates to a visual multi-dimensional display technical framework of urban smart grid panorama information, belonging to the technical field of smart grids. Background technique [0003] With the rapid development of smart grid, the development of visualization platform has become an urgent need. The construction of smart grid visualization focuses on the visualization of the power system and the grid structure. The visualization technology is used to display the structure and operation status of the system in the form of graphics or images, so that system operators can take more effective and targeted measures. Operational controls. [0004] Publication number CN104391919A discloses a smart grid geographic visualization realization system and method, the system includes a geographic information module, a power system information module, a data interaction module, a power flow calculation module, a carbon emission flow calculati...

Claims


Application Information

Patent Timeline
IPC IPC(8): G06Q10/06G06Q50/06
CPCY02P90/84G06Q10/06393G06Q50/06
Inventor 李轶鹏
Owner ELECTRIC POWER RES INST STATE GRID JIANGXI ELECTRIC POWER CO
Learn More