Heavy oil reservoir dissolved gas drive numerical simulation method with bubble oil phenomenon
A technology for dissolved gas flooding and heavy oil reservoirs, which is applied in the fields of climate change adaptation, electrical digital data processing, special data processing applications, etc. Influence of heavy oil dissolved gas flooding development effect, large error in simulation calculation results, etc.
- Summary
- Abstract
- Description
- Claims
- Application Information
AI Technical Summary
Problems solved by technology
Method used
Image
Examples
Embodiment 1
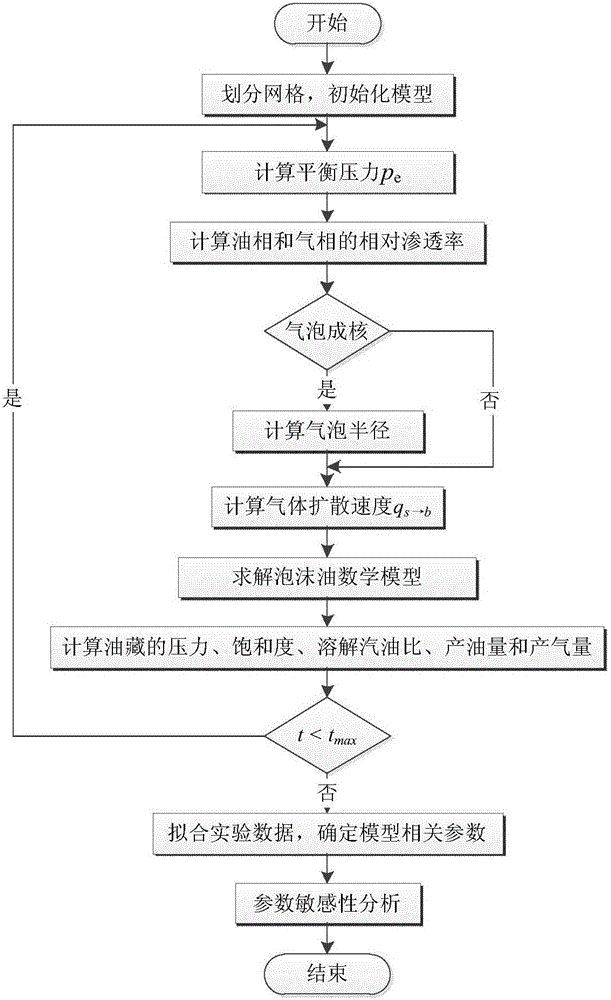
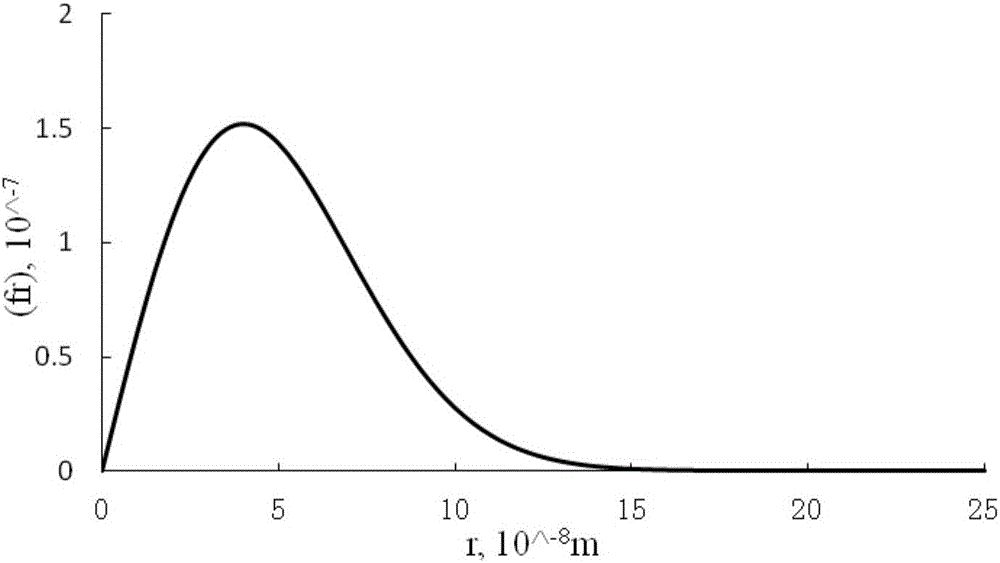
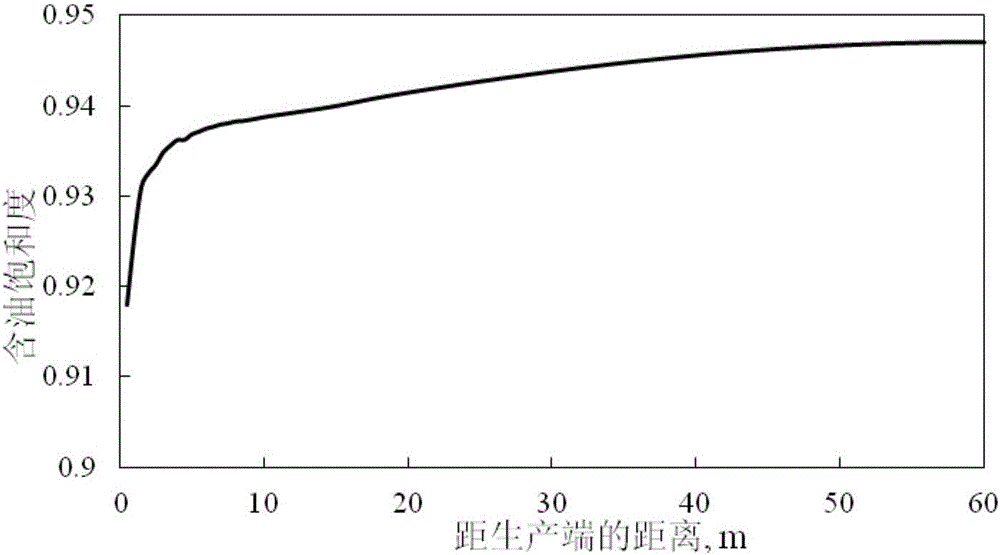
[0079] This embodiment 1 is to fit the experimental data of one-dimensional heavy oil solution gas flooding with foamy oil phenomenon, to determine the unreliable parameters of the model, and to improve the reliable model parameters for the three-dimensional actual reservoir prediction in embodiment 2. In the experiment, the core length of the sand-filled pipe was selected to be 60 cm, and the cross-sectional area was 20 cm. 2 , the permeability of the model is 1.25D, the porosity is 0.386, and the compressibility coefficient of the rock is 3.2×10 - 3 MPa -1 . The experimental temperature is 25°C, the initial pressure of the model is 4.19MPa, the crude oil bubble point pressure is 3.96MPa, the oil-gas interfacial tension γ=30dyne / cm, the crude oil viscosity, crude oil volume coefficient, and dissolved gas-oil ratio under the bubble point pressure are 1100cp, 1.05, 15.57m 3 / m 3 . The left end of the sand filling pipe is closed, and the right end has a fixed production vo...
Embodiment 2
[0154] A solution gas flooding numerical simulation method for heavy oil reservoirs with foamy oil phenomenon as described in Example 1, the difference is that the reservoir area is 300m×300m, the reservoir thickness is 50m, and a well in the middle of the reservoir is Yield 15m 3 / d production, other parameters adopt the parameters obtained by fitting in embodiment 1. The model grid is divided into 15×15×5, other parameters use the parameters after the experiment fitting in the embodiment 1, and the calculation steps are the same as the embodiment 1.
[0155] The reservoir pressure distribution after simulation calculation is shown in Figure 6a , oil phase saturation distribution see Figure 6b . Depend on Figure 6a It can be seen that due to the production of production wells, from the reservoir boundary to the middle of the reservoir, the reservoir pressure gradually decreases and the decreasing speed becomes faster and faster, presenting a funnel-like decline. Depen...
PUM
 Abstract
Description
Claims
Application Information
 - R&D
- Intellectual Property
- Life Sciences
- Materials
- Tech Scout
- Unparalleled Data Quality
- Higher Quality Content
- 60% Fewer Hallucinations
Browse by: Latest US Patents, China's latest patents, Technical Efficacy Thesaurus, Application Domain, Technology Topic, Popular Technical Reports.
© 2025 PatSnap. All rights reserved.Legal|Privacy policy|Modern Slavery Act Transparency Statement|Sitemap|About US| Contact US: help@patsnap.com


