
Dynamic visualization method and system based on big education data

A technology of educational data and big data, applied in the field of educational information display, to achieve the effect of overcoming the single display form

Inactive Publication Date: 2017-02-22
HUAZHONG NORMAL UNIV
View PDF2 Cites 20 Cited by
  • Summary
  • Abstract
  • Description
  • Claims
  • Application Information

AI Technical Summary

Problems solved by technology

[0007] The technical problem to be solved by the present invention is to provide a dynamic visualization method and system based on educational big data in view of the defects in the prior art. The present invention can display massive and complex educational big data in a concise, efficient and intuitive manner , to assist in solving difficult problems such as teaching process quality management, student learning growth monitoring, and intelligent decision-making in education management

Method used


Image

  • Dynamic visualization method and system based on big education data
  • Dynamic visualization method and system based on big education data
  • Dynamic visualization method and system based on big education data

Examples


example

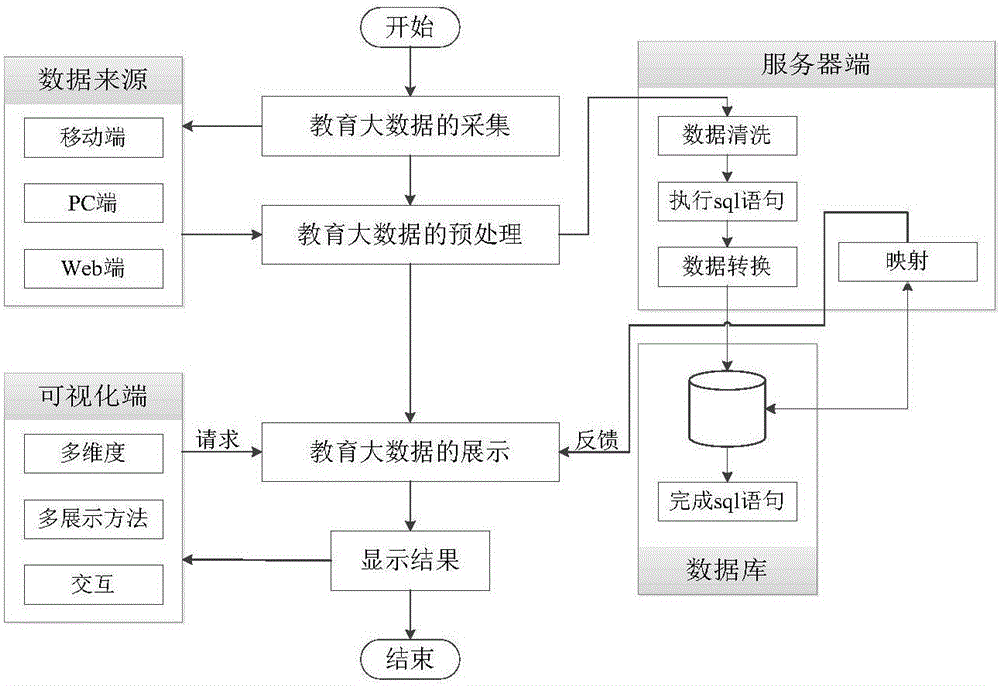
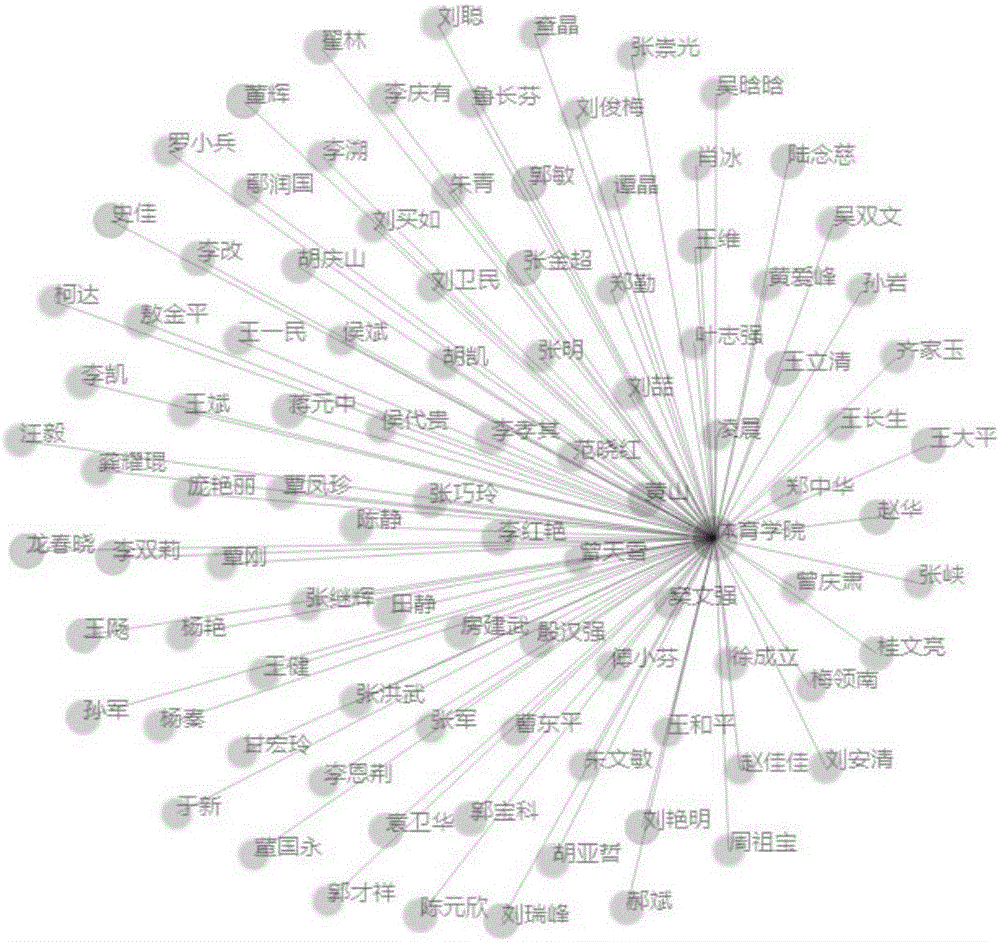
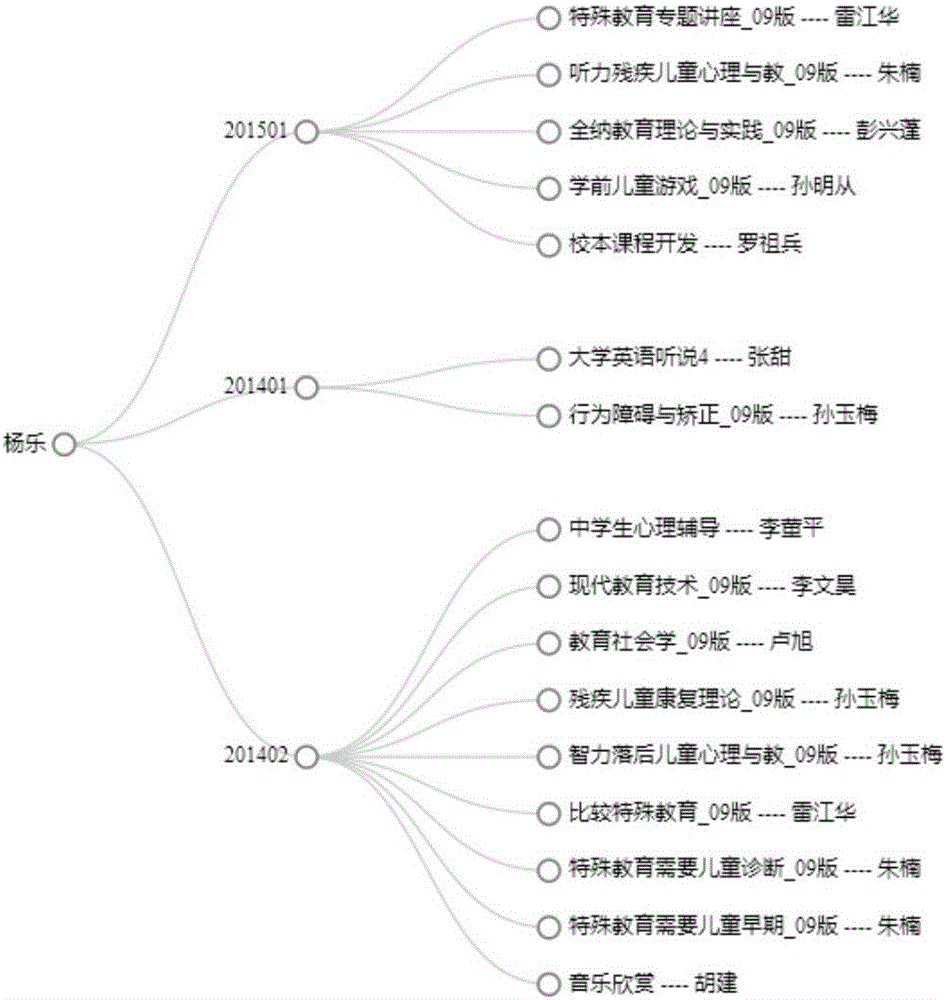
[0051] The above dynamic visualization method of educational big data is applied to the cloud classroom platform independently developed by Central China Normal University. The process is as follows: the cloud classroom platform is used as the collection system of educational big data, and the cloud classroom is divided into mobile terminals, PC terminals and web terminals. , get the data information in the cloud classroom platform; preprocess the obtained data information, supplement the missing data, delete the redundant data, modify the wrong data, and process the data of the three ends into a unified format; based on the cloud classroom platform A data visualization system has been developed to display the data information in the cloud classroom in a multi-dimensional, dynamic and interactive manner. figure 2 with image 3 An example diagram for the visualization of cloud classroom data.

[0052] A dynamic visualization system based on educational big data, including:

...


PUM


Abstract

The invention discloses a dynamic visualization method and system based on big education data. The method comprises the steps that massive teaching process data is collected from an on-line teaching platform; the collected education data is transmitted to a server to be stored, and an education data base is formed; dimension reduction processing is conducted on high-dimensional data in the data base; according to a request of a visualized display terminal, the dimension needing to be presented is queried, and the corresponding data is mined out from a data storage layer, wherein the visualized display terminal is used for dividing the big education data into different dimensions according to the requirements of different users and conducting visualized displaying on a result fed back by the server. According to the method and system, massive complex big education data is displayed in a simple, efficient and visual mode, and the difficult problems such as teaching process quality management, student study and growth monitoring and intelligent education management decision making are assisted to be solved.

Description

technical field [0001] The invention relates to the field of educational information display, in particular to a dynamic visualization method and system based on educational big data. Background technique [0002] In the era of big data, the value of educational data is being re-recognized and evaluated by educators. Educational data is no longer just a bunch of simple "numbers" used for statistics, it is becoming a strategic asset and scientific power to transform education. With the fermenting of the concept of big data in the world, developed countries represented by the United States, the United Kingdom, France, etc. took the lead in using big data as a new type of strategic resource, and regarded it as "the oil of the future". With the rapid development of global education informatization, education data is increasing geometrically. In addition to the data generated by traditional school education, the Internet education market is also generating massive amounts of ed...

Claims


Application Information

Patent Timeline
IPC IPC(8): G06Q50/20
CPCG06Q50/205
Inventor 刘海杨宗凯刘三女牙张昭理舒江波张维刘婷婷李姣姣
Owner HUAZHONG NORMAL UNIV
Learn More