Method and apparatus for stain treatment
A stain, user interface technology applied in the field of near-infrared reflectance spectroscopy, which can solve the problem that the cleaning effect cannot always be achieved
- Summary
- Abstract
- Description
- Claims
- Application Information
AI Technical Summary
Problems solved by technology
Method used
Image
Examples
Embodiment 1
[0083] Example 1 – Full Strength Stain
[0084]NIR spectral data were obtained for each of Stains 1-24 applied to cotton fabrics. The stains are given letter codes a to x respectively.
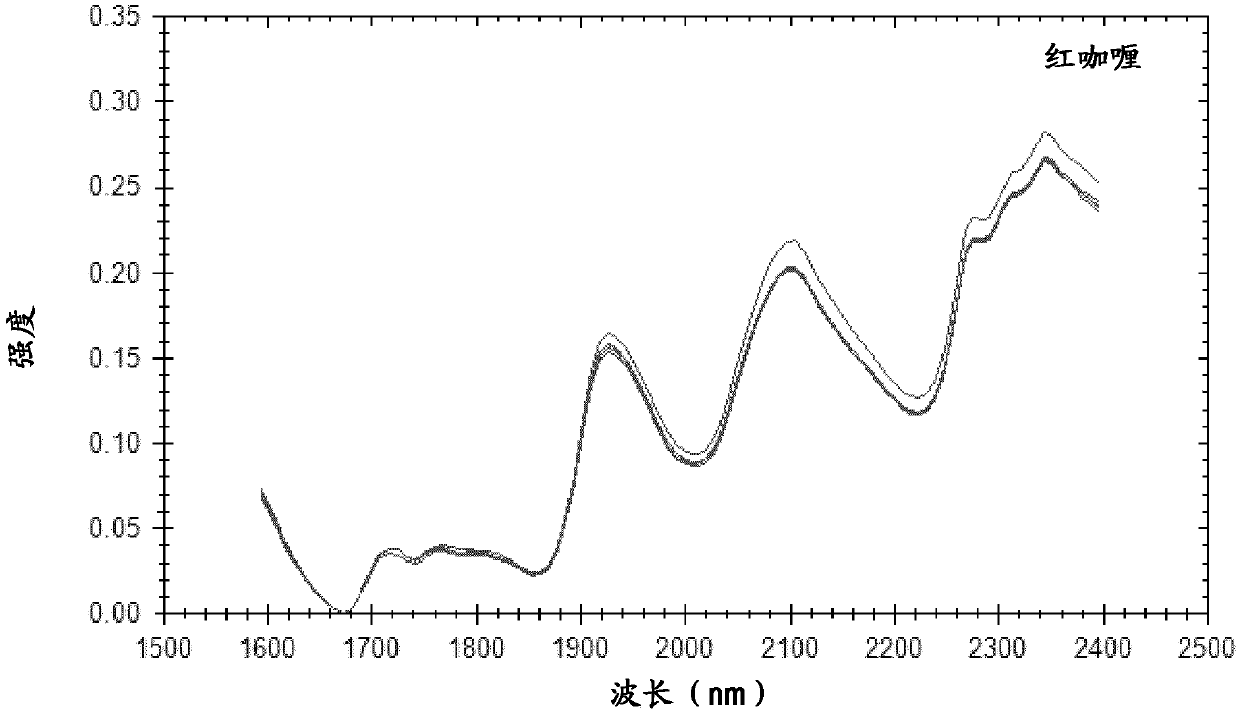
[0085] NIR spectra were collected over a wavelength range from a shortest wavelength of 1595 nm to a longest wavelength of 2397 nm.
[0086] Table 1 – Results for full strength stains
[0087]
[0088]
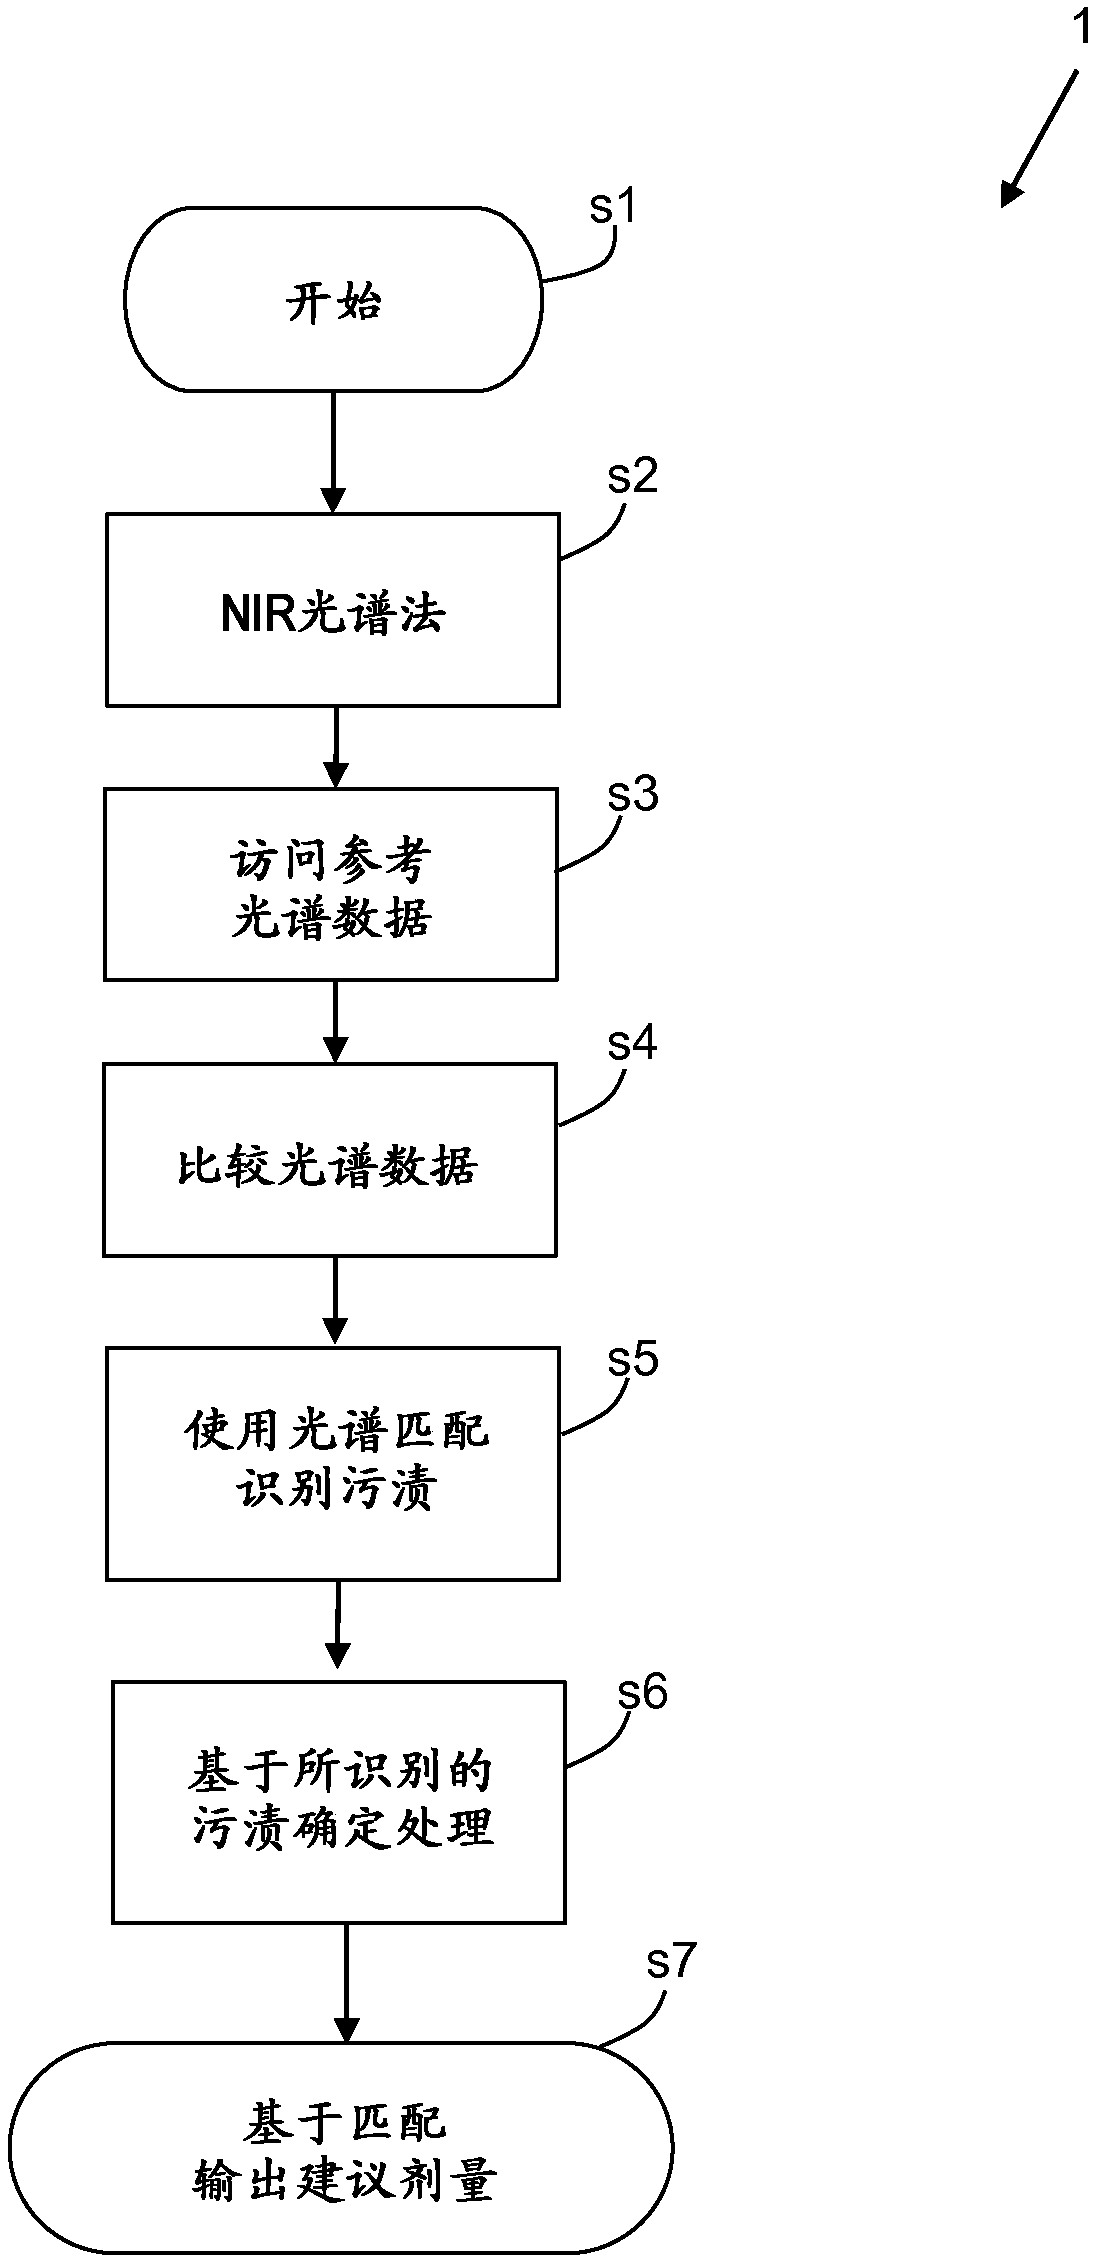
[0089] The resulting spectral data (ie, the acquired signature) is then compared to known values using the methods described in more detail in the detailed description above.
[0090] During acquisition, the spectra appeared to be consistent except for e, k and x (there may be some outliers for their findings). This comparison was by visual inspection of the baseline-adjusted spectra performed on the instrument at the time of data collection, or on the PC via spectral matching, again as described in more detail above.
[0091] Figures 3 to 6 show the level of consistency within a...
Embodiment 2
[0100] Example 2 - Washed Stains
[0101] washed stains
[0102] This example concerns a stain (same stain mentioned above for Example 1) on a cotton test fabric. NIR measurements were performed on the stains as described above for Example 1, but this time the test fabrics were first washed with a commercial liquid. This example therefore attempts to identify washed stains using models built for fresh stains.
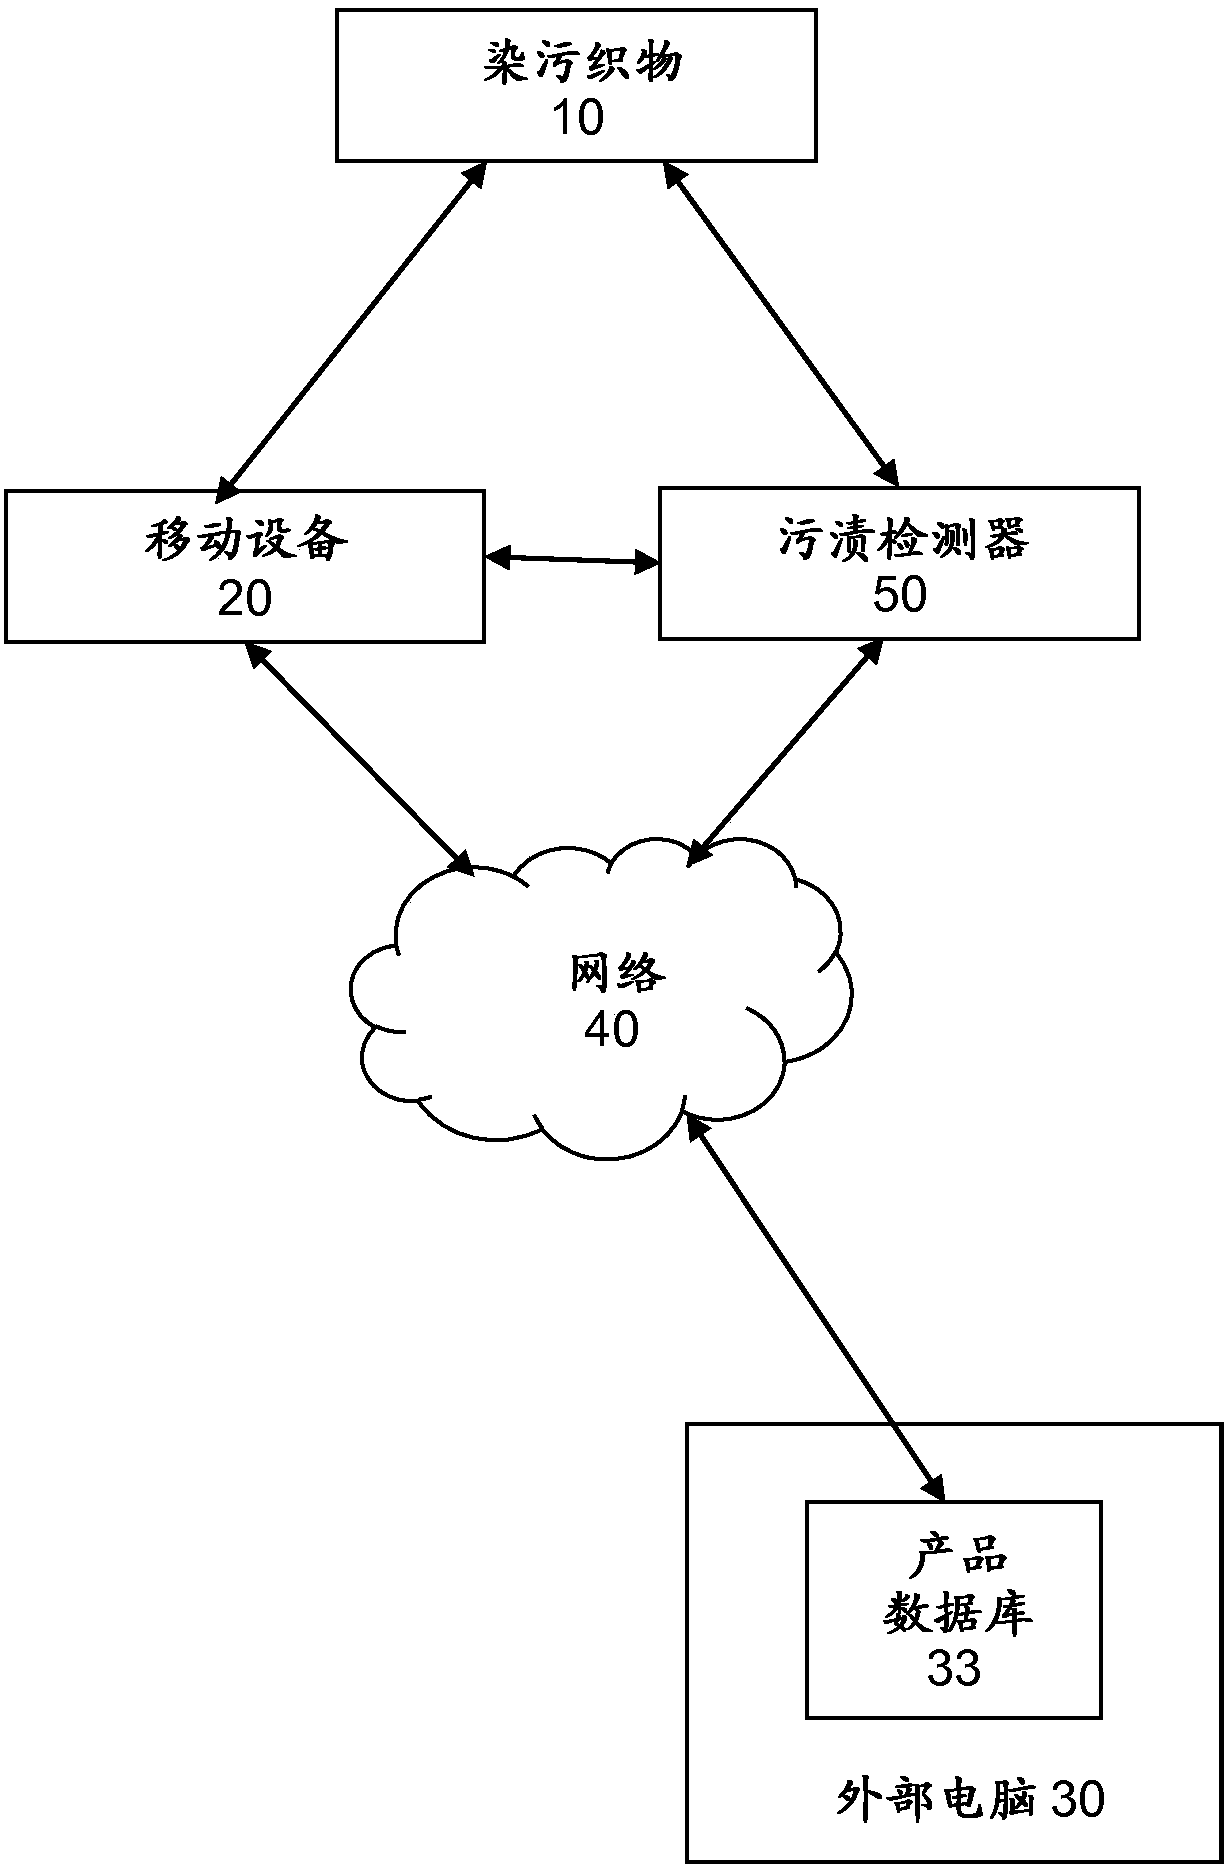
[0103] Again, the method of the invention is then carried out using the stain detection system 50 to identify washed stains.
[0104] Table 3 - Results of washed stains
[0105]
[0106]
[0107] As can be seen from Table 3 above, the spectral matching model (which was built for fresh stains) failed to identify washed stains.
[0108] A new model is then built based on the spectra obtained from the washed stains. The model is then tested for internal consistency. Mismatches of stain types are shown in bold in Table 4 below:
[0109] Table 4 - Mismatch of ...
Embodiment 3
[0114] Example 3 – Analysis by Stain Type
[0115] In this example, combined models (corresponding to both fresh and washed stain libraries) were combined and the application was then used for the instrument on fabric samples.
[0116] As in Examples 1 and 2 above, NIR spectral data was obtained for each of Stains 1-24 applied to cotton fabrics. The stains are given letter codes a to x respectively.
[0117] NIR spectra were collected over a wavelength range from a shortest wavelength of 1595 nm to a longest wavelength of 2397 nm.
[0118] In the table below, the results column indicates the stain type by its initial letter:
[0119] Enzyme = E
[0120] Fat = F
[0121] Particles = P
[0122] Bleach = B
[0123] Note that two measurements were made (two separate stains for each stain type), so the table below includes two results for each sample.
[0124] Table 5 - Comparison of results for concentrated and washed samples
[0125]
[0126]
[0127] Table 5 show...
PUM
 Abstract
Description
Claims
Application Information
 - R&D
- Intellectual Property
- Life Sciences
- Materials
- Tech Scout
- Unparalleled Data Quality
- Higher Quality Content
- 60% Fewer Hallucinations
Browse by: Latest US Patents, China's latest patents, Technical Efficacy Thesaurus, Application Domain, Technology Topic, Popular Technical Reports.
© 2025 PatSnap. All rights reserved.Legal|Privacy policy|Modern Slavery Act Transparency Statement|Sitemap|About US| Contact US: help@patsnap.com


