High-dimensional data visualization method, device and system

A high-dimensional data and data point technology, applied in the field of image processing, can solve problems such as increasing the transfer function dimension, missing a dimension, and difficult high-dimensional operations, etc., to achieve the effect of reducing complexity and increasing speed

Active Publication Date: 2018-08-21
SHENZHEN UNIV
View PDF6 Cites 3 Cited by
  • Summary
  • Abstract
  • Description
  • Claims
  • Application Information

AI Technical Summary

Problems solved by technology

This brings great inconvenience to users
In many cases, the target is very similar to the surrounding objects. At this time, it is necessary to increase the dimension of the data feature value, increase the dimension of the transfer function, and then greatly increase the difficulty of designing the transfer function.
[0004] In addition, users usually use the mouse and keyboard to interact with the visualization system and process high-dimensional data. One of the big limitations is that it is difficult to use the mouse and keyboard to perform high-dimensional operations; another limitation is that users must learn How to use the mouse or keyboard to interact with the visualization system
[0005] In the end, users usually use ordinary monitors as the final visualization medium. The monitor is a two-dimensional plane, and using it to display three-dimensional data will cause a lack of dimension

Method used


Image

  • High-dimensional data visualization method, device and system
  • High-dimensional data visualization method, device and system
  • High-dimensional data visualization method, device and system

Examples


Embodiment 1

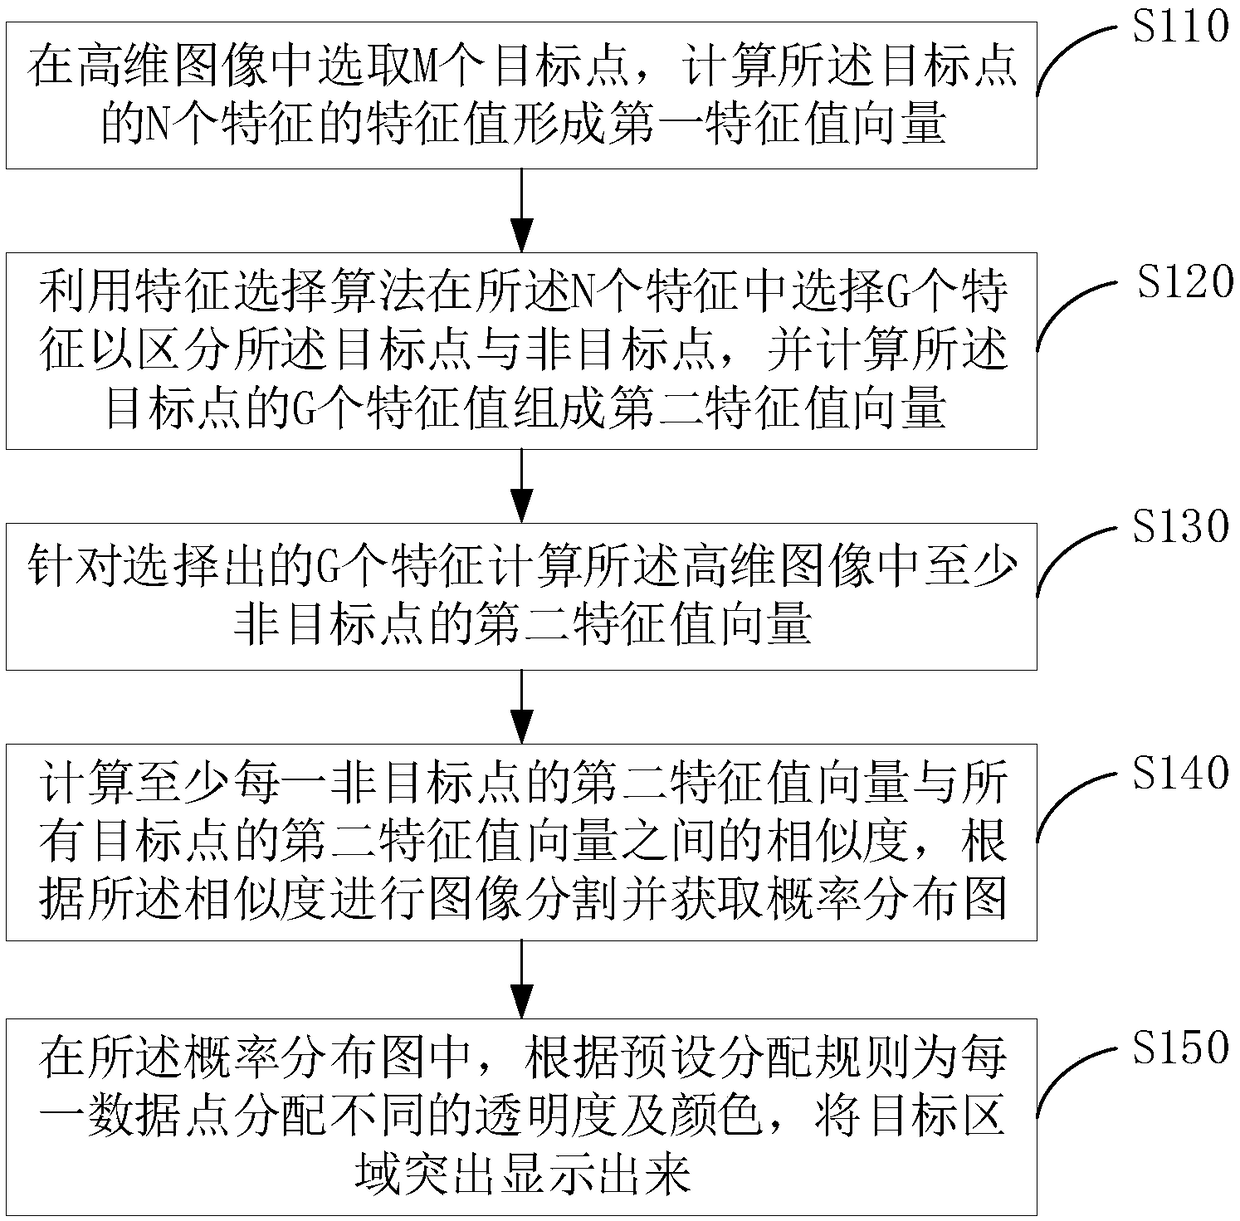
[0052] figure 1 It is a schematic flowchart of a high-dimensional data visualization method proposed in the first embodiment of the present invention. The method includes:

[0053] Step S110, select M target points in the high-dimensional image, and calculate the eigenvalues ​​of N features of the target points to form a first eigenvalue vector.

[0054] Wherein, M is greater than or equal to 1, and N is greater than or equal to 1.

[0055] Wherein, the target area of ​​the high-dimensional image is a two-dimensional section of the high-dimensional image or a visualized three-dimensional space.

[0056] Picking multiple target points in a target region of a high-dimensional image can include:

[0057] Receive the user's voice or gesture data and recognize the operation represented by the data;

[0058] Selecting a plurality of target points in the high-dimensional image in response to the user's voice or gesture operation.

[0059] Wherein, the gesture may include a stati...

Embodiment 2

[0096] Figure 5 It is a schematic flowchart of a high-dimensional data visualization method proposed in the second embodiment of the present invention.

[0097] Step S210, loading high-dimensional data.

[0098] Step S220, drawing a high-dimensional image.

[0099] The high-dimensional data is rendered into a high-dimensional image through a transfer function.

[0100] Step S230, displaying the high-dimensional image through a visualization medium.

[0101] Wherein, the visualization medium is a virtual reality helmet.

[0102] Step S240, receiving voice or gesture data of the user.

[0103] Receive the user's interaction data through the body sensor. Wherein, the interaction data may be voice, gesture or movement trajectory data of gesture, etc.

[0104] Step S250, identifying the operation represented by the voice or gesture data.

[0105] The somatosensory device recognizes the operation indicated by the user's voice, gesture, or motion trajectory of the gesture accor...

Embodiment 3

[0130] Image 6 It is a schematic structural diagram of a high-dimensional data visualization device proposed by an embodiment of the present invention. The high-dimensional data visualization device 10 includes: a first feature vector module 110 , a second feature vector module 120 , a calculation module 130 , an image segmentation module 140 and an allocation module 150 .

[0131] The first eigenvector module 110 is used to select M target points in the high-dimensional image, and calculate the eigenvalues ​​of the N features of the target points to form a first eigenvalue vector, wherein M is greater than or equal to 1, and N is greater than or equal to is equal to 1.

[0132] The second feature vector module 120 is used to select G features from the N features using a feature selection algorithm to distinguish the target points from non-target points, and calculate the G feature values ​​of the target points to form a second feature Vector of values ​​where G is greater ...


PUM


Abstract

The invention provides a high-dimensional data visualization method, a device and a system. The method includes the following steps of: selecting M target points in a high-dimensional image and calculating N eigenvalues of N characteristics of the target points to form a first eigenvalue vector; selecting G characteristics in N characteristics by utilizing a character selection algorithm to distinguish the target points and the non-target points, calculating G eigenvalues of the target points to form a second eigenvalue vector; calculating a second eigenvalue vector of at least non-target points in the high-dimensional image for the selected G characteristics; calculating similarity between the second eigenvalue vector of at least each non-target point and the second eigenvalue vector of all target points, performing image segmentation according to the similarity and acquiring a probability distribution diagram; in the probability distribution diagram, different transparency and colorsare allocated to each data point according to a preset distribution rule and the target area is highlighted. According to the invention, the target area is highlighted by the image processing technology and the processing rate of the system for high-dimensional data is improved.

Description

technical field [0001] The present invention relates to the technical field of image processing, in particular to a high-dimensional data visualization method, device and system. Background technique [0002] 3D volume rendering is a common visualization method for high-dimensional data. Suppose there is a three-dimensional glass cube, by changing the color and transparency of each point in the glass cube, the user will see different scenes from the glass cube. 3D volume rendering is a technique for projecting high-dimensional data onto a display medium. [0003] In the process of traditional 3D volume rendering, the transfer function links the data eigenvalues ​​with the optical eigenvalues, which plays a very important role in the final data visualization. In order to highlight specific objects in volume rendering, users often need to design a complex transfer function and constantly adjust the transfer function according to the real-time visualization. This brings grea...

Claims


Application Information

Patent Timeline
IPC IPC(8): G06T3/00
CPCG06T3/08
Inventor 余夏夏常城高毅
Owner SHENZHEN UNIV
Why Eureka
Try Eureka