

Analyzing method for heart rate variability based on linear amplitude spectrum
A technology of heart rate variability and analysis method, applied in the field of analysis of heart rate variability, to achieve a reasonable design effect
- Summary
- Abstract
- Description
- Claims
- Application Information
AI Technical Summary
Problems solved by technology
Method used
Image

Examples
Embodiment 1
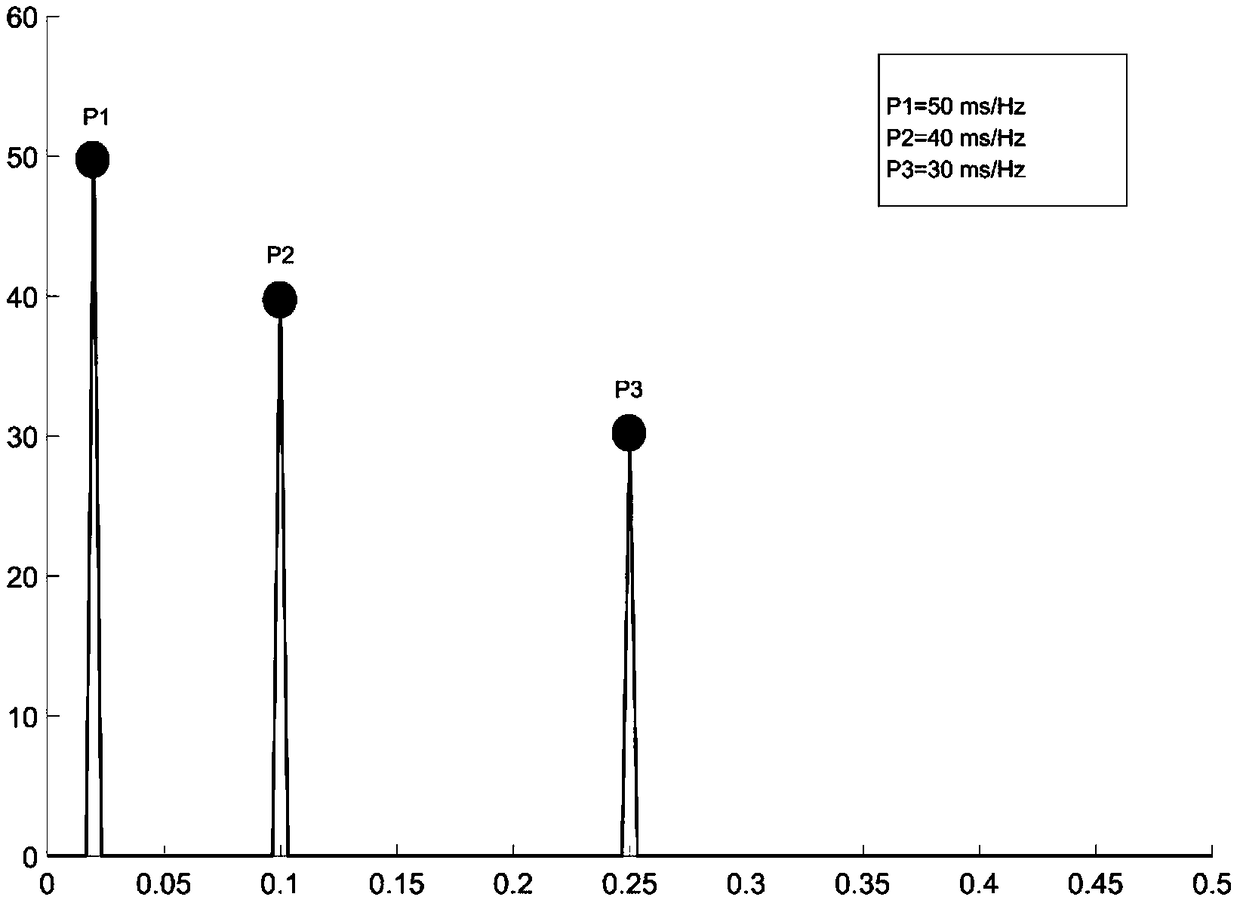
[0058] In this embodiment, the RR interval time series x[n] of 512 data points is simulated by Matlab software, and the sampling frequency is 2Hz, and x[n]=Σ i a i sin[2πnf i ], i=VLF, LF, HF; where f VLF = 0.02Hz, f LF = 0.09Hz, f HF = 0.20Hz; a VLF = 50ms, a LF = 40ms and a HF = 30ms.
[0059] The HRV analysis method of the linear amplitude spectrum is carried out according to the following steps:
[0060] Step S1: Since the simulated HRV sequence is a uniform sequence with a sampling frequency of 2 Hz, resampling is not required;
[0061] Step S2: performing discrete-time Fourier transform DFT(x(n)) on the S1 time interval sequence;
[0062] Step S3: Calculate and obtain the linear amplitude spectrum according to the formula LAS(k)=|DFT(x(n))| / (N / 2), the linear amplitude spectrum is as follows figure 1 shown;
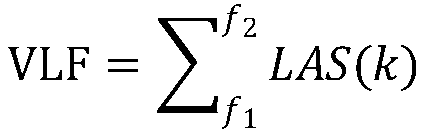
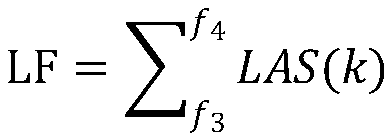
[0063] Step S4: Based on the linear amplitude spectrum LAS(k), sum the extremely low frequency VLF, low frequency LF, and high frequency HF, and calculate f...
Embodiment 2
[0066] In this embodiment, a segment of human HRV signal analysis from a resting state is performed, and the specific steps are as follows:
[0067] Step S1: Resampling the target HRV signal at a frequency of 2 Hz to obtain a uniform time interval sequence x(n) (n=0, 1, ..., N-1), where N is the length of the signal sequence;
[0068] Step S2: Perform discrete-time Fourier transform DFT(x(n)) on the S1 time interval sequence.
[0069] Step S3: Calculate and obtain the linear amplitude spectrum according to the formula LAS(k)=|DFT(x(n))| / (N / 2).
[0070] Step S4: Based on the linear amplitude spectrum LAS(k), integrate the extremely low frequency VLF, low frequency LF, and high frequency HF to calculate five frequency domain parameters: extremely low frequency amplitude VLF, low frequency amplitude LF, high frequency amplitude Value HF, total amplitude TP and R.
[0071] In order to compare with the power spectrum and show the superiority of the linear amplitude spectrum, the ...
PUM
 Abstract
Description
Claims
Application Information