Mass-spectrometry-imaging-data processing device

A data processing device and mass spectrometry analysis technology, which is applied in image data processing, electrical digital data processing, image analysis, etc., can solve problems such as inability to save images and user troubles

Inactive Publication Date: 2019-04-26
SHIMADZU SEISAKUSHO CO LTD
View PDF8 Cites 0 Cited by
  • Summary
  • Abstract
  • Description
  • Claims
  • Application Information

AI Technical Summary

Problems solved by technology

Such work is not only troublesome for the user, but also has the problem of not being able to save the confirmed image itself as information

Method used


Image

  • Mass-spectrometry-imaging-data processing device
  • Mass-spectrometry-imaging-data processing device
  • Mass-spectrometry-imaging-data processing device

Examples


Embodiment Construction

[0044] Hereinafter, an embodiment of an imaging mass spectrometry system including an imaging mass spectrometry data processing device according to the present invention will be described with reference to the attached drawings.

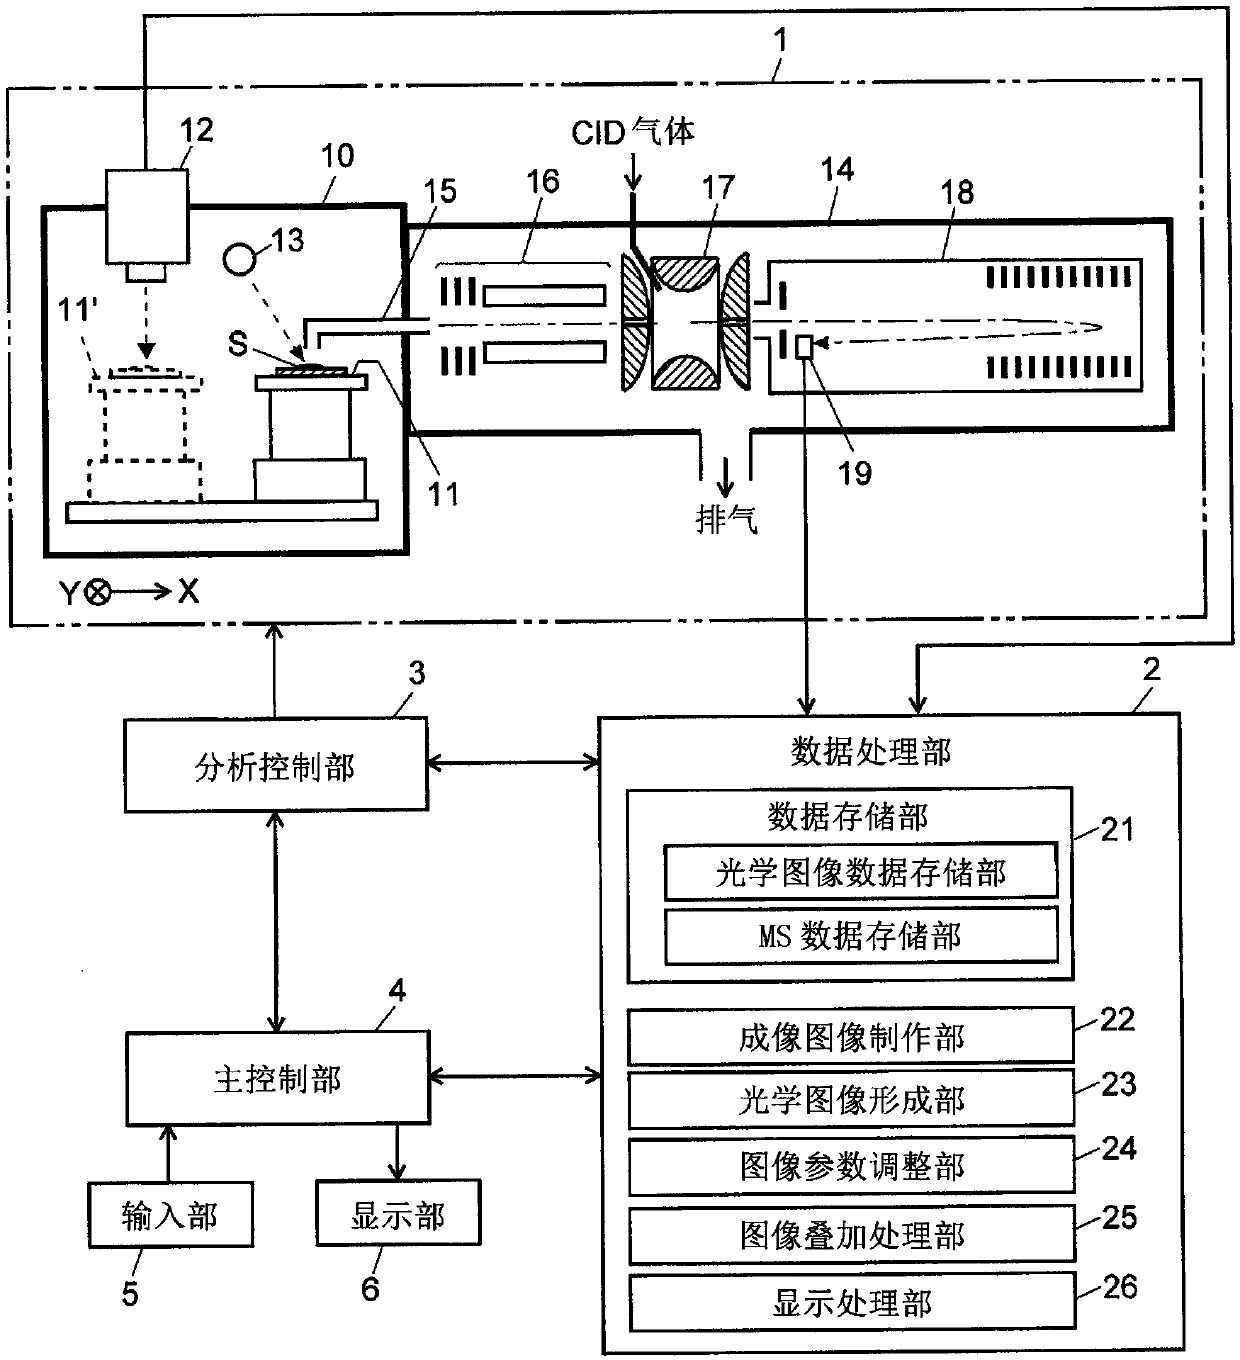
[0045] figure 1 is a schematic configuration diagram of the imaging mass spectrometry system of this embodiment.

[0046] The imaging mass spectrometry apparatus of this embodiment includes: a measurement unit 1 capable of performing mass spectrometry analysis on a large number of measurement points (micro regions) in a two-dimensional region on the sample S to acquire mass spectrum data for each measurement point; data processing A part 2, which stores and processes the data obtained by the measurement part 1; an analysis control part 3, which controls the operation of each part included in the measurement part 1; a main control part 4, which manages the overall control of the system, user interface, etc.; An input section 5, which is operated by ...


PUM


Abstract

In the present invention, an optical image formation unit (23) forms an optical image corresponding to a region of interest on the basis of data obtained through the photography of the surface of a sample (S) and an imaging image creation unit (22) creates an imaging image indicating the spatial distribution of ions having a designated m / z value on the basis of mass spectrum data obtained for eachmeasurement point in the region of interest. An image superposition processing unit (25) creates an image resulting from the superposition of an optical image and an imaging image for a prescribed m / z value in accordance with user instruction, and a display processing unit (26) displays the image on the screen of a display unit (6). When a user carries out a prescribed operation, the display processing unit (26) displays a setting screen for adjusting the brightness and contrast of the optical image, and an image parameter adjustment unit (24) adjusts the brightness and contrast of the optical image in the superposition image independently from the imaging image according to operations on the screen. As a result, it is possible to display a superposition image in which it is easy to see,for example, the spatial distribution of components even if a photographed optical image is too bright.

Description

technical field [0001] The invention relates to an imaging mass spectrometry data processing device for processing data obtained by the imaging mass spectrometry device. Background technique [0002] The mass spectrometry imaging method is a method for studying the spatial distribution of substances with specific masses by performing mass spectrometry analysis on multiple measurement points (micro regions) in a two-dimensional area of ​​a sample such as a biological tissue slice, respectively. This mass spectrometry imaging method is being increasingly applied to drug discovery, biomarker discovery, and cause identification of various diseases and diseases. A mass spectrometry device for performing mass spectrometry imaging is generally referred to as an imaging mass spectrometry device. In addition, an arbitrary two-dimensional area on the sample is usually observed with an optical microscope, and the area to be analyzed is determined based on the optical image and imaging...

Claims


Application Information

Patent Timeline
Patent Type & Authority Applications(China)
IPC IPC(8): G01N27/62
CPCH01J49/0004H01J49/0027G06T7/11G06T7/174G06T5/009G06T5/50G06T2207/10024G06T2207/20221H01J49/0036H01J49/164H01J49/40H01J49/4225G06F3/04845
Inventor 绪方是嗣池上将弘
Owner SHIMADZU SEISAKUSHO CO LTD
Why Eureka
Try Eureka