A Multimodal Traffic Anomaly Detection Method Based on Travel Time Distribution

A travel time and anomaly detection technology, applied in the field of traffic detection, can solve problems such as failure to consider the influence of weather and traffic situation changes, inability to analyze the characteristics and causes of abnormal traffic conditions, and lack of basis for traffic scene division, and achieve good detection results. Highly reliable, well-characterized effects

Active Publication Date: 2021-06-15
TONGJI UNIV
View PDF22 Cites 0 Cited by
  • Summary
  • Abstract
  • Description
  • Claims
  • Application Information

AI Technical Summary

Problems solved by technology

However, the characterization of the traffic situation is too simplified, and it is impossible to analyze the characteristics and causes of abnormal traffic conditions; there is no basis for the division of traffic scenes, and the influence of weather and other factors on traffic situation changes cannot be considered.

Method used


Image

  • A Multimodal Traffic Anomaly Detection Method Based on Travel Time Distribution
  • A Multimodal Traffic Anomaly Detection Method Based on Travel Time Distribution
  • A Multimodal Traffic Anomaly Detection Method Based on Travel Time Distribution

Examples


Embodiment 1

[0169] Step 11. Use the equidistant space-time division method to determine the segment scale of the time dimension. The span of the time segment is a fixed value, usually 30 minutes is taken as a time segment; the segment scale of the space dimension is determined, and the span of the space segment is a fixed value, usually 200m× The 200m spatial grid serves as a spatial segment.

[0170] Step 12, perform data preprocessing, and perform data cleaning, data integration, data conversion, and data reduction on the GNSS positioning data to improve the degree of structure of the data.

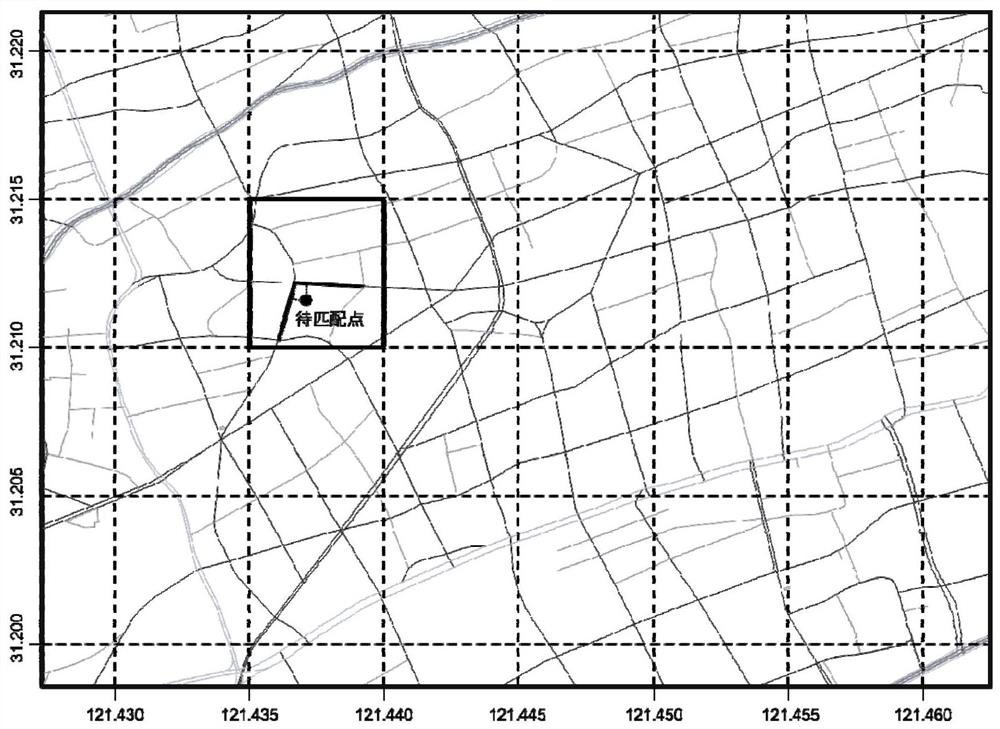
[0171] Step 13. Divide the spatial area to be processed into grids of a certain size, and the range of each grid area can be expressed as A s ={(x s ,y s )|x s ∈[x r ,x r+1 ),y s ∈[y r ,y r+1 )}; Determine the grid area where the anchor point is located, and use the distance and azimuth to search for the road section where the anchor point is located; search for the road section closest to ...

Embodiment 2

[0192] Step 21. Use the equidistant space-time division method to determine the segment scale of the time dimension. The span of the time segment is a fixed value, usually 30 minutes as a time segment; determine the segment scale of the space dimension, and the span of the space segment is a fixed value, usually 200m× The 200m spatial grid serves as a spatial segment.

[0193] Step 22, perform data preprocessing, and perform data cleaning, data integration, data conversion, and data reduction on the GNSS positioning data to improve the degree of structure of the data.

[0194] Step 23. Divide the spatial area to be processed into grids of a certain size, and the range of each grid area can be expressed as A s ={(x s ,y s )|x s ∈[x r ,x r+1 ),y s ∈[y r ,y r+1 )}; Determine the grid area where the anchor point is located, and use the distance and azimuth to search for the road section where the anchor point is located; search for the road section closest to point A, and ...

Embodiment 3

[0232] Step 31, using the non-equidistant space-time division method, for the road network density greater than 2km / km 2 Or in the central area of ​​the city where the peak hour traffic flow is greater than 1000 vehicles / hour, a time segment of 30 minutes and a space segment of 200m×200m are taken, and the road network density is less than 2km / km 2 Or in the suburbs of cities where the peak hour flow rate is less than 1000 vehicles / hour, take a time segment of 30 minutes and a space segment of 400m×400m.

[0233] Step 32, perform data preprocessing, and perform data cleaning, data integration, data conversion, and data reduction on the GNSS positioning data to improve the degree of structure of the data.

[0234] Step 33. Divide the spatial area to be processed into grids of a certain size, and the range of each grid area can be expressed as A s ={(x s ,y s )|x s ∈[x r ,x r+1 ),y s ∈[y r ,y r+1 )};

[0235] Denote the GNSS data acquisition frequency of the floating v...


PUM


Abstract

A multi-modal traffic anomaly detection method based on travel time distribution, using the vehicle-mounted GNSS positioning device of the floating car, can obtain its spatial location information at different times, and through the analysis and mining of massive floating car track information, it can realize urban road traffic Intelligent detection of abnormal events. The detection method uses the probability distribution of the travel time to represent the traffic state, uses the probability distribution difference measurement index to reflect the traffic state difference, and considers the traffic state difference under various environmental states. It has the characteristics of clear principle, simple implementation and high detection rate.

Description

technical field [0001] The invention belongs to the technical field of traffic detection. In particular, the present invention relates to a real-time detection method for urban road traffic anomalies. Through the vehicle-mounted GNSS positioning device of the floating vehicle, its spatial position information at different times can be obtained, and after data preprocessing, map matching and data fusion, the probability distribution of travel time in a specific space-time range can be obtained; according to the change of travel time distribution, it can be effectively Identify abnormal events in urban road traffic. Background technique [0002] Traffic anomaly event detection is an important part of urban traffic management and one of the core functions of intelligent transportation systems. Abnormal traffic events mainly include traffic accidents, vehicle breakdowns, falling objects from trucks, damage or failure of road traffic facilities, and other special events that ca...

Claims


Application Information

Patent Timeline
Patent Type & Authority Patents(China)
IPC IPC(8): G08G1/01
CPCG08G1/0112G08G1/0129G08G1/0133G08G1/0141G08G1/00G08G1/01G06F16/00
Inventor 杜豫川邓富文
Owner TONGJI UNIV
Why Eureka
Try Eureka