Three-dimensional visual typhoon analysis method

An analysis method and 3D technology, applied in the field of typhoon analysis of 3D visualization, can solve the problems such as the threshold for the commercial application of 3D visualization products and the lack of graphic analysis templates for physical processes, so as to achieve rapid integration and improve the effect of rendering space dimensions.

Pending Publication Date: 2019-10-25
国家气象信息中心
View PDF1 Cites 1 Cited by
  • Summary
  • Abstract
  • Description
  • Claims
  • Application Information

AI Technical Summary

Problems solved by technology

[0005] However, so far, there are still barriers to the commercial application of 3D visualization products
On the one hand, the 3D rendering algorithm involves a large number of parameters, which requires the support of a com

Method used


Image

  • Three-dimensional visual typhoon analysis method
  • Three-dimensional visual typhoon analysis method
  • Three-dimensional visual typhoon analysis method

Examples


Embodiment approach 1

[0031] 1: Data and tools

[0032] 1. Grid data

[0033] 1.1 Forecast products

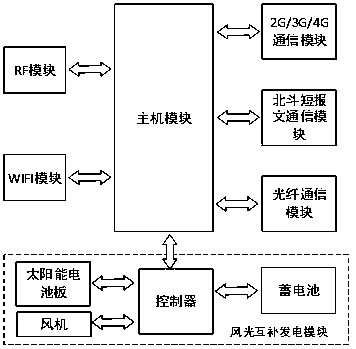
[0034] The rendering data involved include the European Center (ECWMF) Atmospheric Model 3 / 6 hourly deterministic fine-grid forecast products (HRES) for the next ten days.

[0035] The horizontal resolution of this product is 0.25°×0.25°, the cloud elements mainly include cloud cover (cc), etc., and there are 137 layers in the model coordinate system in the vertical direction; the isobaric surface elements mainly include three-dimensional wind components (u / v / w ), air temperature (t), humidity (r / q), potential height (gh), etc., there are 19 layers at 1000hPa-10hPa in the vertical direction on the isobaric coordinate system.

[0036] 1.2 Live Products

[0037] The rendering data involved also includes hourly reanalysis meteorological products (CRA) of the China Meteorological Administration.


PUM


Abstract

The invention discloses a three-dimensional visual typhoon analysis method. The method comprises the following steps: firstly, carrying out scalar rendering; carrying out vector rendering; and finally, carrying out spatial information fusion and carrying out playing according to a time sequence. Compared with a previous analysis method, the method has the following advantages that the method is simple, rich and visual, and in general, three-dimensional visualization is introduced into weather analysis work, so that service personnel can be helped to visually know the three-dimensional structure of a weather system, verify the accuracy of mode prediction, check the reliability of assimilation data, guide the construction and optimization of an observation station network and the like.

Description

technical field [0001] The invention relates to the field of meteorological analysis, in particular to a three-dimensional visualized typhoon analysis method. Background technique [0002] Accurately analyzing the three-dimensional structure of typhoons is of great significance for understanding the evolution process, intensity and range of typhoons and improving typhoon forecasts [1] . In many previous literatures, a wide variety of two-dimensional views have been designed for analyzing the three-dimensional structure of typhoons [2-4] , in order to restore the real three-dimensional typhoon structure as completely as possible with multi-view plane images. However, if the typhoon can be displayed stereoscopically in a three-dimensional image, many types of two-dimensional analysis image sequences can be visually represented in one image. [0003] In recent years, advances in sensing technology, data storage, computing power, and software structure have greatly enhanced t...

Claims


Application Information

Patent Timeline
IPC IPC(8): G06T15/00G06T17/05
CPCG06T15/00G06T17/05Y02A90/10
Inventor 张志强冯明农杨和平张强
Owner 国家气象信息中心
Why Eureka
Try Eureka