A new high-speed rail hub accessibility impact method based on an improved two-step mobile search method
An accessibility and hub technology, applied in data processing applications, instruments, calculations, etc., can solve the problems of discussing the relationship between high-speed rail hubs and urban residents' accessibility, and achieve the effect of balanced distribution and improved accuracy
- Summary
- Abstract
- Description
- Claims
- Application Information
AI Technical Summary
Problems solved by technology
Method used
Image
Examples
Embodiment 1
[0104] The road network is decomposed into a road network system based on intersection point elements and adjacent elements, and a road network search system including road edge, junction and turning information is established.
[0105] Select January 1, 2017 to analyze the floating car data, and get the time-varying law of the number of floating cars in one day, as shown in Table 1, find out that the peak time of the tourist day is 19:15-19:30.
[0106] Table 1
[0107]
[0108]
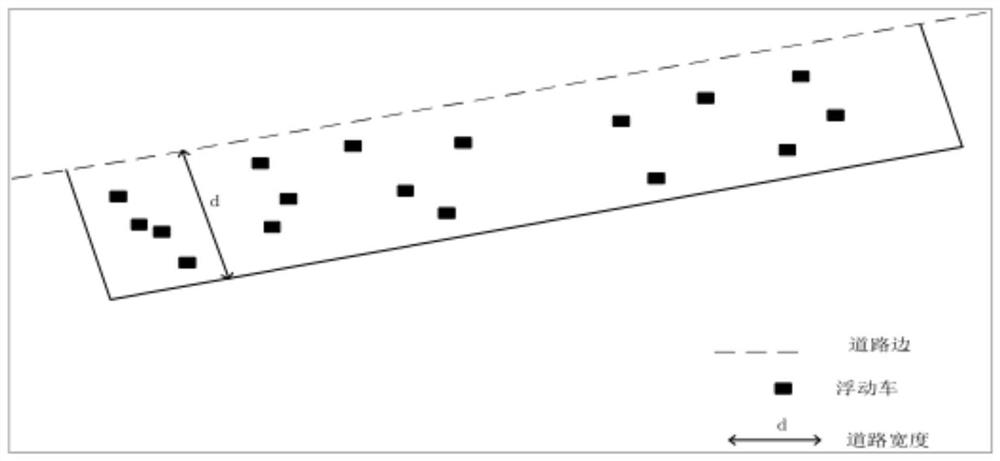
[0109] take the road s 1 For example, establish a spatial influence surface range s with a road width of 30m m , match the GPS data of the floating car with the road network data during the peak travel period, connect them according to the spatial position of the two, and count and summarize the number of floating cars in their spatial influence area, which is 1773. The speed of each GPS data is shown in Table 2. Show.
[0110] Table 2
[0111] Floating car ID Speed (km / h) ...
Embodiment 2
[0134]Calculate the standard deviation and average of the current accessibility of current city A, city B, and city C, and the results are shown in Table 9.
[0135] Table 9
[0136]
[0137] Calculate the variation coefficient of current accessibility of city A, city B, and city C, and obtain the variation coefficient of current status as shown in Table 10.
[0138] Table 10
[0139]
[0140]
[0141] The standard deviation, average value, and coefficient of variation of the planned accessibility of the three cities after the new high-speed rail hub 3 are calculated, as shown in Table 11.
[0142] Table 11
[0143]
[0144] Calculate the Spearman rank correlation coefficient of the accessibility of the current administrative divisions of City A, City B, and City C before and after the establishment of the high-speed rail hub, as shown in Table 12.
[0145] Table 12
[0146] city A city B city C Spearman's rank correlation coefficient...
Embodiment 3
[0148] Calculate the accessibility change rates of city A, city B, and city C. As shown in Table 13, the accessibility change rates of the three cities are positive, which improves the accessibility of the region.
[0149] Table 13
[0150] city A city B city C Achievable rate of change A rate
65.85% 30.43% 107.69%
[0151] According to the actual situation of city A, city B, and city C, set the coefficient of variation parameter, when α 1 =0, a 2 =0.1, α 3 When = 1, as shown in Tables 10 and 11, before the new high-speed rail hub, the coefficients of variation of city A and city B are moderate accessibility variability, which is in a reasonable range of accessibility distribution, and the coefficient of variation of city C is strong. Accessibility variability, the spatial distribution of accessibility is more clustered. After the new high-speed rail hub was added, the coefficients of variation of the three cities were all within a rea...
PUM
 Abstract
Description
Claims
Application Information
 - R&D
- Intellectual Property
- Life Sciences
- Materials
- Tech Scout
- Unparalleled Data Quality
- Higher Quality Content
- 60% Fewer Hallucinations
Browse by: Latest US Patents, China's latest patents, Technical Efficacy Thesaurus, Application Domain, Technology Topic, Popular Technical Reports.
© 2025 PatSnap. All rights reserved.Legal|Privacy policy|Modern Slavery Act Transparency Statement|Sitemap|About US| Contact US: help@patsnap.com


