
Three-dimensional visualization method and system based on real-time dynamic segmentation and reconstruction

A real-time dynamic, three-dimensional technology, applied in image data processing, special data processing applications, instruments, etc., can solve the problems of incomplete and unintuitive industrial field data monitoring, and achieve the effect of solving incomplete and unintuitive monitoring.

Active Publication Date: 2019-11-12
CENT SOUTH UNIV
View PDF9 Cites 8 Cited by
  • Summary
  • Abstract
  • Description
  • Claims
  • Application Information

AI Technical Summary

Problems solved by technology

[0005] A three-dimensional visualization method and system based on real-time dynamic segmentation and reconstruction provided by the present invention solves the technical problem that traditional industrial monitoring software is not comprehensive and intuitive to monitor industrial field data

Method used


Image

  • Three-dimensional visualization method and system based on real-time dynamic segmentation and reconstruction
  • Three-dimensional visualization method and system based on real-time dynamic segmentation and reconstruction
  • Three-dimensional visualization method and system based on real-time dynamic segmentation and reconstruction

Examples


Embodiment 1

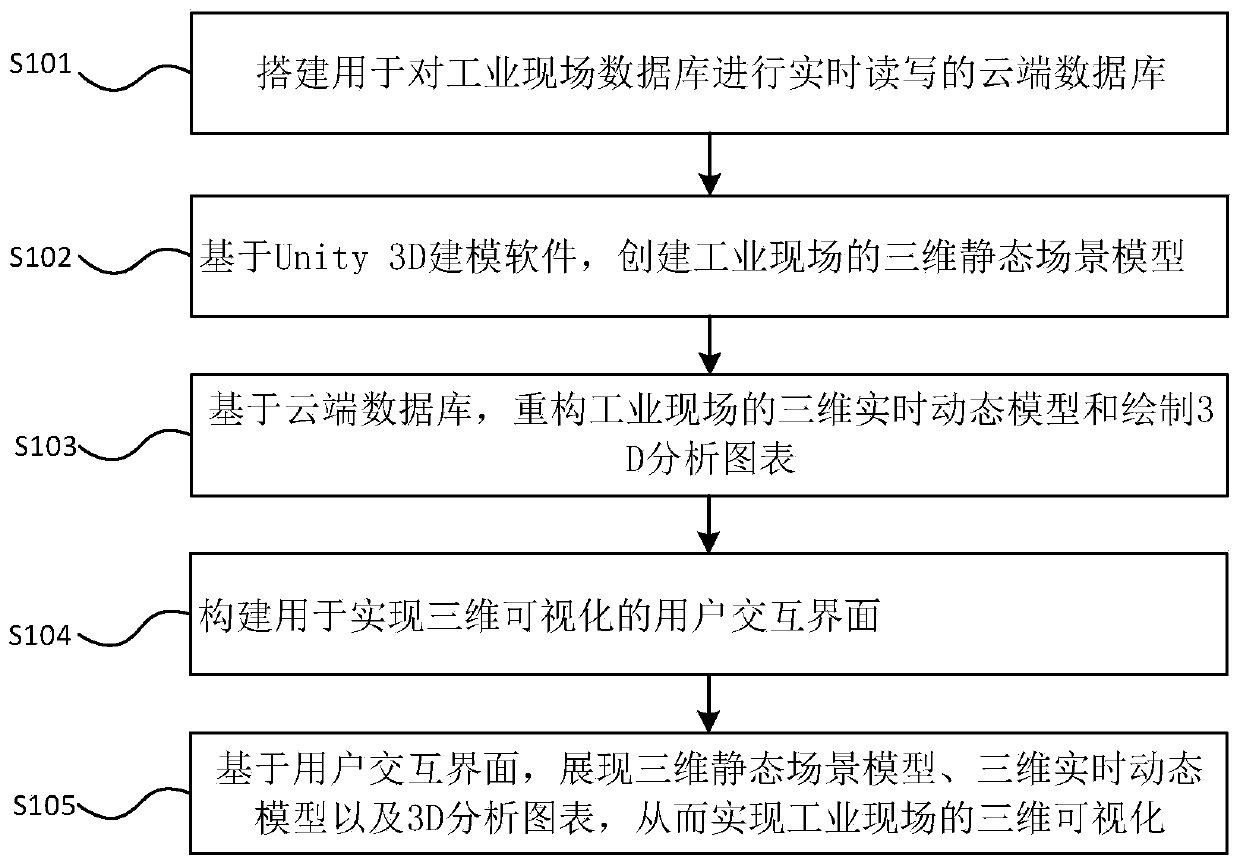
[0068] refer to figure 1 The 3D visualization method based on real-time dynamic segmentation and reconstruction provided by Embodiment 1 of the present invention includes:

[0069] Step S101, building a cloud database for real-time reading and writing of industrial field databases;

[0070] Step S102, based on the Unity 3D modeling software, create a three-dimensional static scene model of the industrial site;

[0071] Step S103, based on the cloud database, reconstructing the 3D real-time dynamic model of the industrial site and drawing 3D analysis charts;

[0072] Step S104, constructing a user interaction interface for realizing 3D visualization;

[0073] Step S105 , based on the user interface, displaying a 3D static scene model, a 3D real-time dynamic model, and a 3D analysis chart, thereby realizing 3D visualization of the industrial site.

[0074] The three-dimensional visualization method based on real-time dynamic segmentation and reconstruction provided by the emb...

Embodiment 2

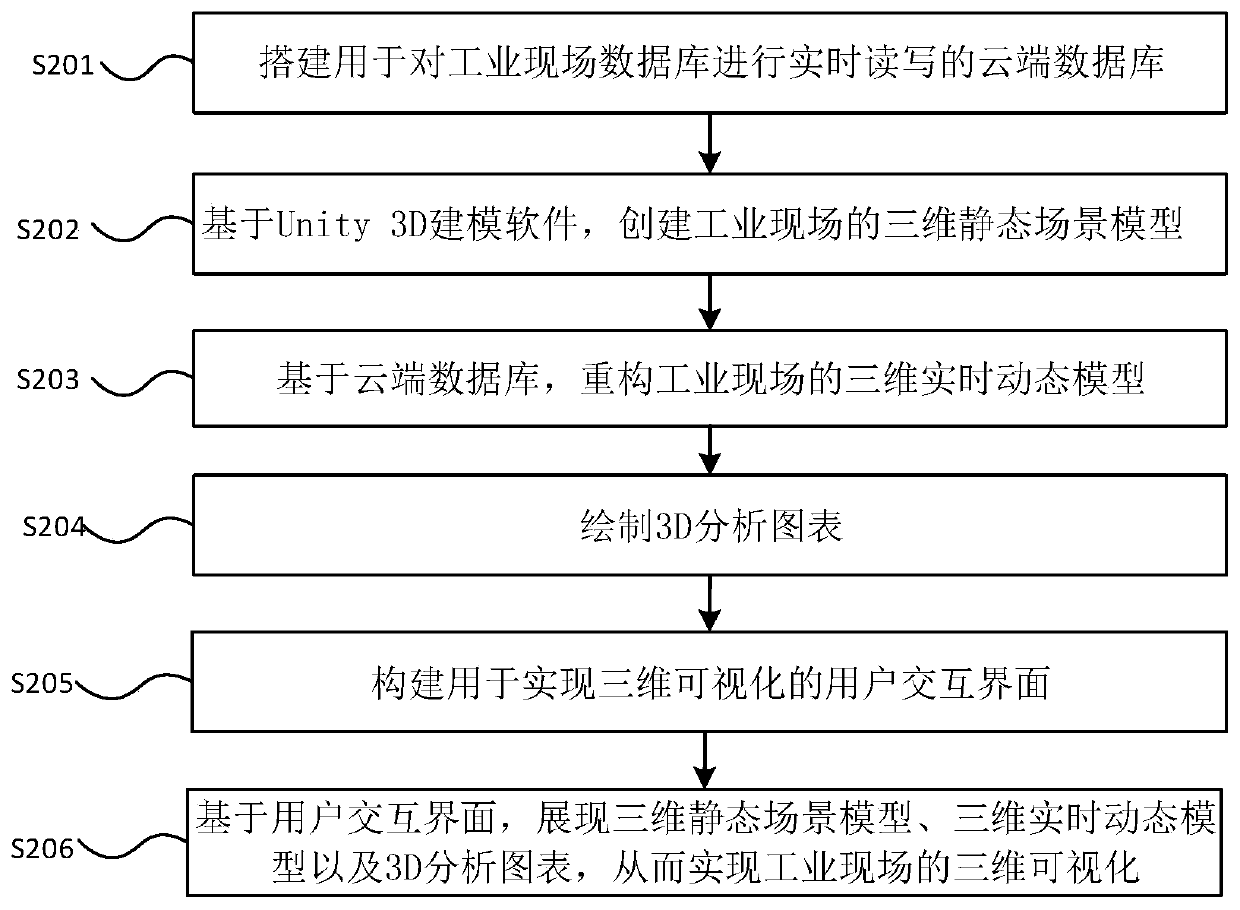
[0077] refer to figure 2 , Embodiment 2 of the present invention takes the blast furnace ironmaking process in industrial production as an example, and provides a three-dimensional visualization method based on real-time dynamic segmentation and reconstruction, including:

[0078] Step S201, building a cloud database for real-time reading and writing of industrial field databases.

[0079] When building a cloud database for real-time reading and writing of industrial field databases in this embodiment, first build a cloud database on the server based on SQL server programming, and then establish a remote connection between the cloud database and the industrial field database, thereby realizing the industrial field database. The database reads and writes, including:

[0080] Step S2011, create a database on the server based on SQL server programming, and create related list data and the like through programming.

[0081] Step S2012, realize the remote connection with the on-...


PUM


Abstract

The invention discloses a three-dimensional visualization method and system based on real-time dynamic segmentation and reconstruction. The method includes: establishing a cloud database, creating a three-dimensional static scene model of an industrial field; based on the cloud database, reconstructing a three-dimensional real-time dynamic model of an industrial field and drawing a 3D analysis chart; constructing a user interaction interface; achieving three-dimensional visualization of an industrial field based on the user interaction interface. The technical problem that traditional industrial monitoring software is not comprehensive or visual in industrial field data monitoring is solved. Based on industrial field data obtained in real time, A three-dimensional real-time dynamic model and a 3D analysis chart can be generated; the static scene model is used to display the change condition of the data in a more intuitive manner, omnibearing real-time monitoring is carried out on the working condition of the industrial field, 3D visualization of a measurable object of the industrial field is realized, and the method has the advantages of real-time performance, operability, high compatibility and intuition, and is suitable for data monitoring of the industrial field.

Description

technical field [0001] The invention relates to the field of industrial data visualization, in particular to a three-dimensional visualization method and system based on real-time dynamic segmentation and reconstruction. Background technique [0002] Industry is an important pillar industry for national development. Industrial production is a process in which information acquisition is difficult and the process is intricate. In order to further grasp the operation law and operation status of industrial field production, the visualization of industrial field data becomes particularly important. Traditional data visualization mainly presents the distribution of data in the form of 2D charts. The advantage of 2D charts is that they can intuitively and easily understand the changes in low-dimensional data from a macro perspective. With the increasing demand for industrial data, 2D charts cannot further analyze the complex relationship between multi-dimensional coupled data fro...

Claims


Application Information

Patent Timeline
IPC IPC(8): G06F17/50G06T17/00
CPCG06T17/00
Inventor 蒋朝辉刘金狮陈致蓬桂卫华叶飞强谢永芳阳春华
Owner CENT SOUTH UNIV
Learn More