Enterprise service and application intelligent monitoring system
An intelligent monitoring system and enterprise service technology, applied in hardware monitoring, instruments, electrical digital data processing, etc., to achieve the effect of improving productivity and recovering direct economic losses
- Summary
- Abstract
- Description
- Claims
- Application Information
AI Technical Summary
Problems solved by technology
Method used
Image
Examples
Embodiment 1
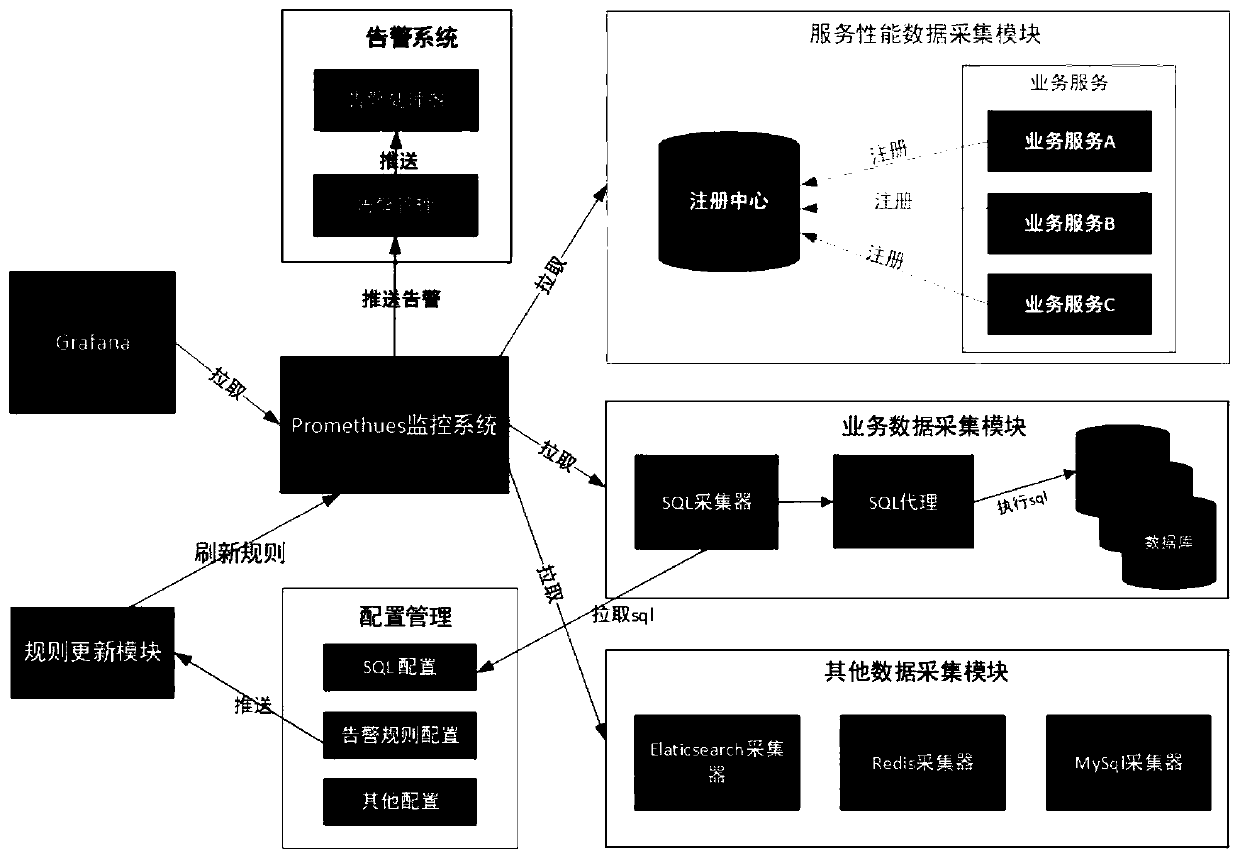
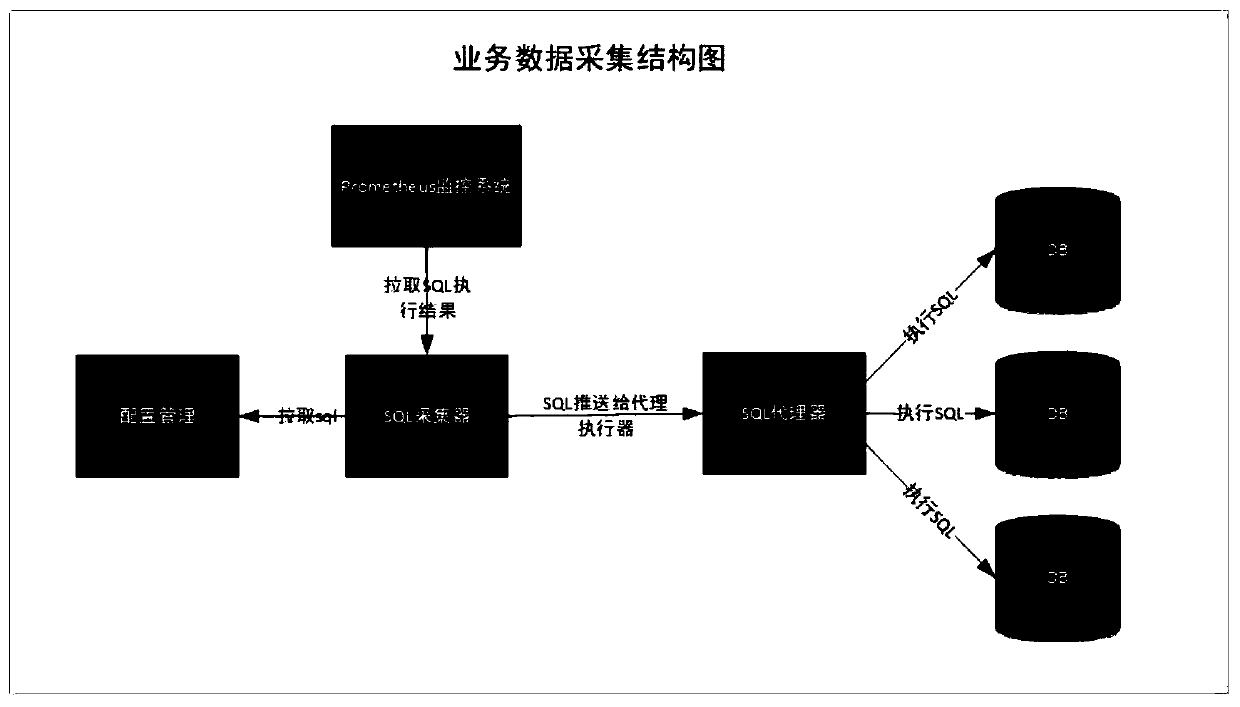
[0028] Enterprise service and application intelligent monitoring system, including system service monitoring and operation data monitoring, system service monitoring consists of eight modules: service performance data acquisition module, business data acquisition module, other data acquisition modules, alarm system, Prometheus monitoring system, Configuration management module, alarm rule update module, Grafana module;
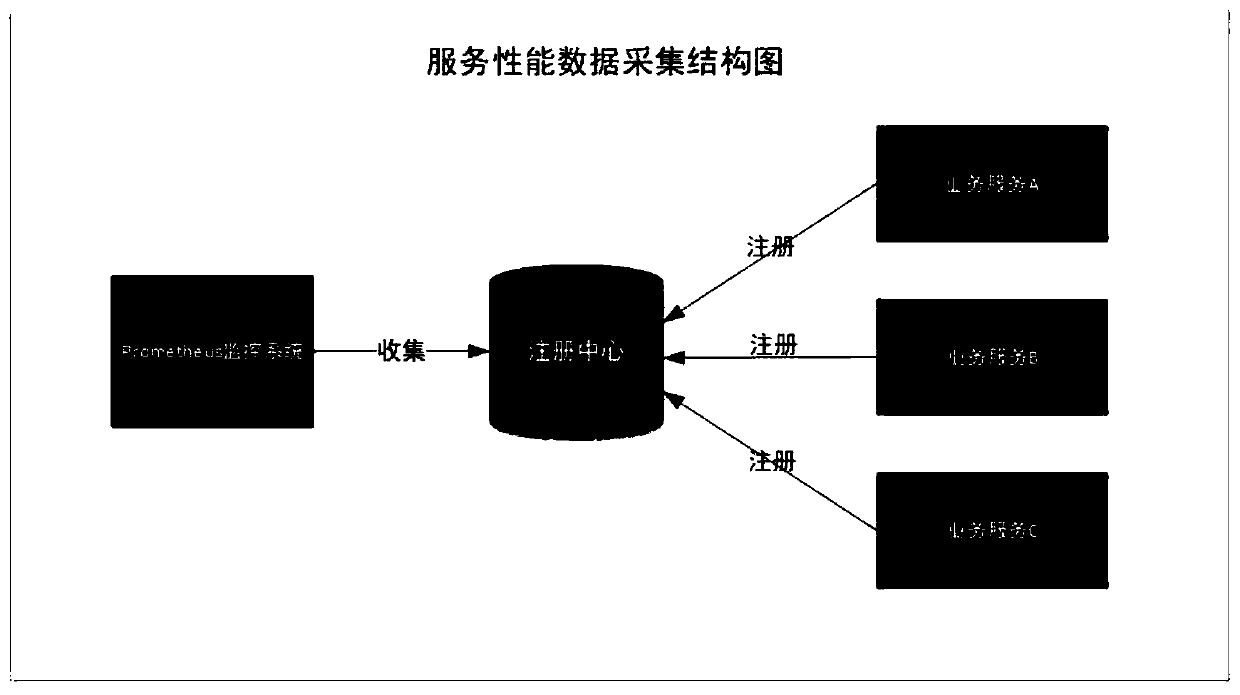
[0029] System service monitoring is mainly done using the Consul registration center. Each service that needs to be monitored must be integrated in Prometheus, the system performance indicators are registered in Prometheus, and then each service is registered in Consul. Prometheus dynamically discovers by configuring Consul , to collect performance indicator data of all services in Consul;
[0030] In terms of monitoring data, system performance data and business index data are generated through their respective data acquisition modules, and then the Prometheu...
Embodiment 2
[0043] On the basis of the first embodiment, the present invention provides a corresponding solution for how to use monitoring data. System performance data and business index data are generated through their respective data acquisition modules, and then the Prometheus monitoring module pulls these data and saves them on the data storage server. When using these data, a series of analysis and calculations are performed to set early warnings threshold.
[0044] In system performance data analysis, the present invention will observe the running trend of system performance indicators, such as:
[0045] 1. In the JVM indicator, the number of GC pauses or the rate of change of the GC pause time within each 5 minutes is used to judge the performance pressure of the current service. The PromQL expression is as follows:
[0046] irate(jvm_gc_pause_seconds_count{instance="$instance", service="$service"}[5m])
[0047] irate(jvm_gc_pause_seconds_sum{instance="$instance", service="$serv...
PUM
 Abstract
Description
Claims
Application Information
 - R&D Engineer
- R&D Manager
- IP Professional
- Industry Leading Data Capabilities
- Powerful AI technology
- Patent DNA Extraction
Browse by: Latest US Patents, China's latest patents, Technical Efficacy Thesaurus, Application Domain, Technology Topic, Popular Technical Reports.
© 2024 PatSnap. All rights reserved.Legal|Privacy policy|Modern Slavery Act Transparency Statement|Sitemap|About US| Contact US: help@patsnap.com


