Statistical method and device for service traffic in mobile communication system

A mobile communication system and service flow technology, applied in the field of mobile communication systems, can solve the problems of not being able to completely and accurately describe various 5G services and service flow characteristics, relying on realistic statistical data, etc., to ensure calculation accuracy, clear logic, The effect of small amount of calculation

Active Publication Date: 2020-04-21
SOUTHEAST UNIV
3 Cites 0 Cited by

AI-Extracted Technical Summary

Problems solved by technology

However, mMTC and URLLC services are the service types used in the new industry of machine-to-machine communication, which are very different from the services mainly aimed at human-to-human communication in 4G
Therefore, the traditional model cannot completely and accurately describe the characteristics of various 5G services and service traffic, and it may be necessary to establish a new mathematical model according to their different characteristics and requirements
In the 4G communication system, a calculation-based modeling method for traffic...

Method used

A structure module of a kind of realization device of described method is as shown in Figure 2, and device is responsible for carrying out modeling statistics to the business of application scene in mobile communication system, and then carries out statistical analysis to the business flow of application scene, comprises four Modules: input module, business modeling statistics module, traffic statistics module and analysis module. The input module receives the business use case of the application scenario, and determines the business model and related parameters of the session layer and the packet layer of each business according to the business use case; Establish a mathematical model of the probability ...

Abstract

The invention discloses a statistical method and device for service flow in a mobile communication system. The method comprises the following steps: determining a service model and related parametersof each service session layer and packet layer according to a service case of an application scene in the mobile communication system; mathematical modeling and mathematical statistics of the data rate are circularly carried out on the session layer and the packet layer of each service in the scene; when all the services are modeled and counted, service flow statistics under the multi-user and multi-service condition in the application scene is carried out, and a service flow statistics model is obtained; and finally, analyzing a result by using a picture or mathematical fitting mode accordingto actual requirements to obtain an intuitive expression form or a mathematical analytic expression of the flow. The method is clear in logic, accurate in calculation, low in complexity and small inoperand, and can be used for counting the service flow of an application scene in a mobile communication system, analyzing a statistical result and providing basic data of capacity bearing requirements for network planning of a wireless access network and a core network in the mobile communication system.

Application Domain

Technology Topic

Real-time computingService flow +9

Image

  • Statistical method and device for service traffic in mobile communication system
  • Statistical method and device for service traffic in mobile communication system
  • Statistical method and device for service traffic in mobile communication system

Examples

  • Experimental program(1)

Example Embodiment

[0074] Example
[0075] This embodiment provides a statistical method for business traffic in telemedicine application scenarios. Telemedicine application scenarios include 8 business use cases: heart rate sensors, blood pressure sensors, pulse sensors, body temperature sensors, health monitoring, remote surgery, virtual video conferencing in ambulances and hospitals, and interconnection between ambulances and hospital medical equipment. The relevant parameters of the business use case are shown in Table 2.
[0076] Table 2 Business use case related parameters
[0077]
[0078]
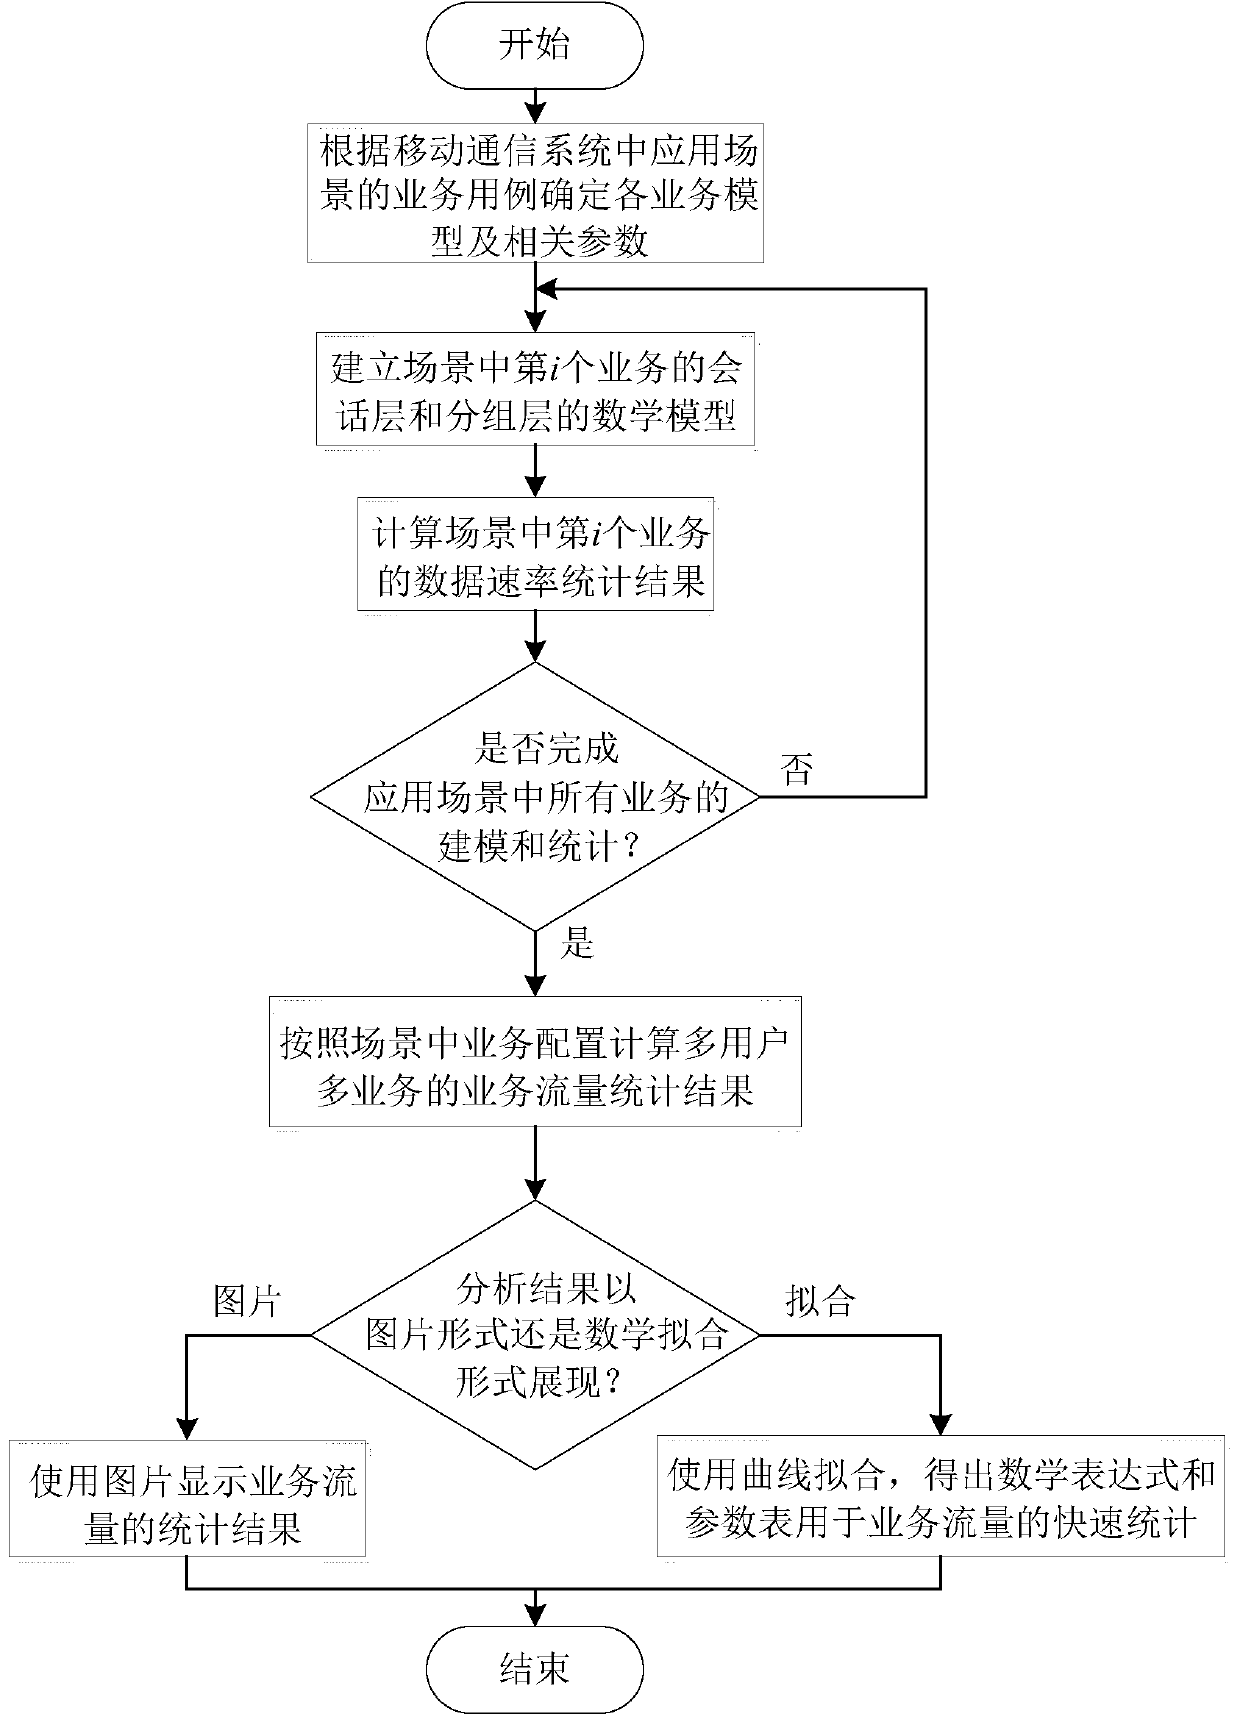
[0079] The statistical method of business traffic in telemedicine application scenarios includes the following steps:
[0080] Step 1: Enter the relevant parameters of the business use case of the telemedicine application scenario. Among them, the application scenario contains 8 services, which are heart rate sensor, blood pressure sensor, pulse sensor, body temperature sensor, health monitoring, remote surgery, ambulance, and hospital The virtual video conference, ambulance and hospital medical equipment interconnection; the corresponding business model is shown in Table 2.
[0081] Step 2: According to the probability distribution of the data transmission rate of the session layer service of each service and the probability distribution of the data transmission rate of the packet layer service, establish a mathematical model of the probability distribution of the data transmission rate of each service in this scenario. The mathematical model of the transmission rate is shown in Table 3;
[0082]
[0083] Where P i session (r) is the probability distribution of the service transmission rate of the session layer, P i packet (r) is the probability distribution of the packet layer service transmission rate, P i session (r) and P i packet (r) can be calculated from the business model listed in Table 2, f i (r) is the probability density function PDF of the data transmission rate of the i-th service based on the mathematical model of the session layer and the packet layer of the i-th service, and r is the data transmission rate requirement.
[0084] Table 3 Mathematical model of service data transmission rate
[0085]
[0086] The third step: According to the mathematical model obtained in the second step, the following formula is used to calculate the statistical results of the data transmission rate of each service in the scenario;
[0087]
[0088]
[0089]
[0090] Where f i s (r) is the pair f i (r) Discrete value after sampling, Is the impulse function, Is the sampling interval of the i-th service data transmission rate, N is the number of sampling points, the value is 6000000, max(r i ) Refers to the maximum value of the i-th service data transmission rate, min(r i ) Refers to the minimum value of the i-th service data transmission rate, F is a constant close to 1, and the value is 0.99999.
[0091] Step 4: According to the number of users in the scenario and the configuration of the service, the following formula is used to calculate the result of the service flow statistics in the case of multi-user and multi-service;
[0092]
[0093]
[0094] Where f s (r) is the business traffic statistics result of multiple users and multiple services in telemedicine application scenarios, f i s (r) is the statistical result of the data transmission rate of the i-th service, n i Is the number of users of the i-th business.
[0095] In order to reduce the computational complexity, the above formula can be optimized using fast Fourier transform FFT and inverse fast Fourier transform IFFT:
[0096]
[0097] Step 5: Use the picture display method to display the statistical results of the business traffic. The PDF and CDF curve diagrams of the data transmission rate of the telemedicine application scenario are as follows image 3 with Figure 4 Shown. It can be seen from the figure that the curves of Analytic and Monte-Carlo are basically the same in trend, and the error deviation is small. It can be seen from the PDF graph that the scene data transmission rate is mainly concentrated in 6×10 10 Below bps, it can be concluded from the CDF graph combined with the simulation data that the data transmission rate of the scene is lower than 9×10 10 The probability at bps is 99%, so the core network equipment should provide at least a data transmission rate of 9×10 10 bps carrying capacity.
[0098] Or, use the curve fitting method to follow the following rules to obtain mathematical expressions and parameter tables for fast calculation of business traffic.
[0099]
[0100] Among them, Eq(r) is the fitting mathematical expression, Is the sampling sequence, N s F s (r) the number of samples, and satisfy
[0101]
[0102] In this embodiment, the statistical result of business traffic in the telemedicine scenario can be fitted to an 8-order Gaussian distribution, as shown in the following formula:
[0103]
[0104] The parameters in the formula are as follows:
[0105] Table 4 Fitting curve parameter table
[0106] parameter Value parameter Value parameter Value a1
[0107] According to the obtained fitting mathematical expression and parameter table, fast calculation of business flow in telemedicine scenarios can be realized.

PUM

no PUM

Description & Claims & Application Information

We can also present the details of the Description, Claims and Application information to help users get a comprehensive understanding of the technical details of the patent, such as background art, summary of invention, brief description of drawings, description of embodiments, and other original content. On the other hand, users can also determine the specific scope of protection of the technology through the list of claims; as well as understand the changes in the life cycle of the technology with the presentation of the patent timeline. Login to view more.

Similar technology patents

Classification and recommendation of technical efficacy words

  • Guaranteed calculation accuracy
  • Clear logic

Sound source positioning device and method based on track moving double microphone arrays

ActiveCN104459625AGuaranteed calculation accuracyReduce the number of microphonesPosition fixationAcoustic source localizationEngineering
Owner:NANJING UNIV OF SCI & TECH

Calculation method of finite element model of simplified guyed tower main column

InactiveCN105426599AGuaranteed calculation accuracySmall amount of calculationDesign optimisation/simulationSpecial data processing applicationsMass distributionTorsional rigidity
Owner:NORTH CHINA ELECTRIC POWER UNIV (BAODING)

Fast obtaining method of dose distribution of photon beam in target body

InactiveCN103425875AIncrease acquisition speedGuaranteed calculation accuracySpecial data processing applicationsPhoton beamClassical mechanics
Owner:NANJING UNIV OF AERONAUTICS & ASTRONAUTICS

Method for monitoring sleep respiration based on snore signals

InactiveCN104688229AClear logicCost controlRespiratory organ evaluationSensorsMonitor sleepEmergency medicine
Owner:PLA UNIV OF SCI & TECH +2
Why Eureka
Try Eureka