

Method for generating visual representation of wellbore drilling parameters
A drilling parameter and drilling technology, applied in wellbore/well components, earthwork drilling, measurement, etc., can solve the problem of difficulty in establishing correlation of offset well data, and achieve the effect of visual analysis and convenient drilling operation.
- Summary
- Abstract
- Description
- Claims
- Application Information
AI Technical Summary
Problems solved by technology
Method used
Image

Examples
Embodiment 1
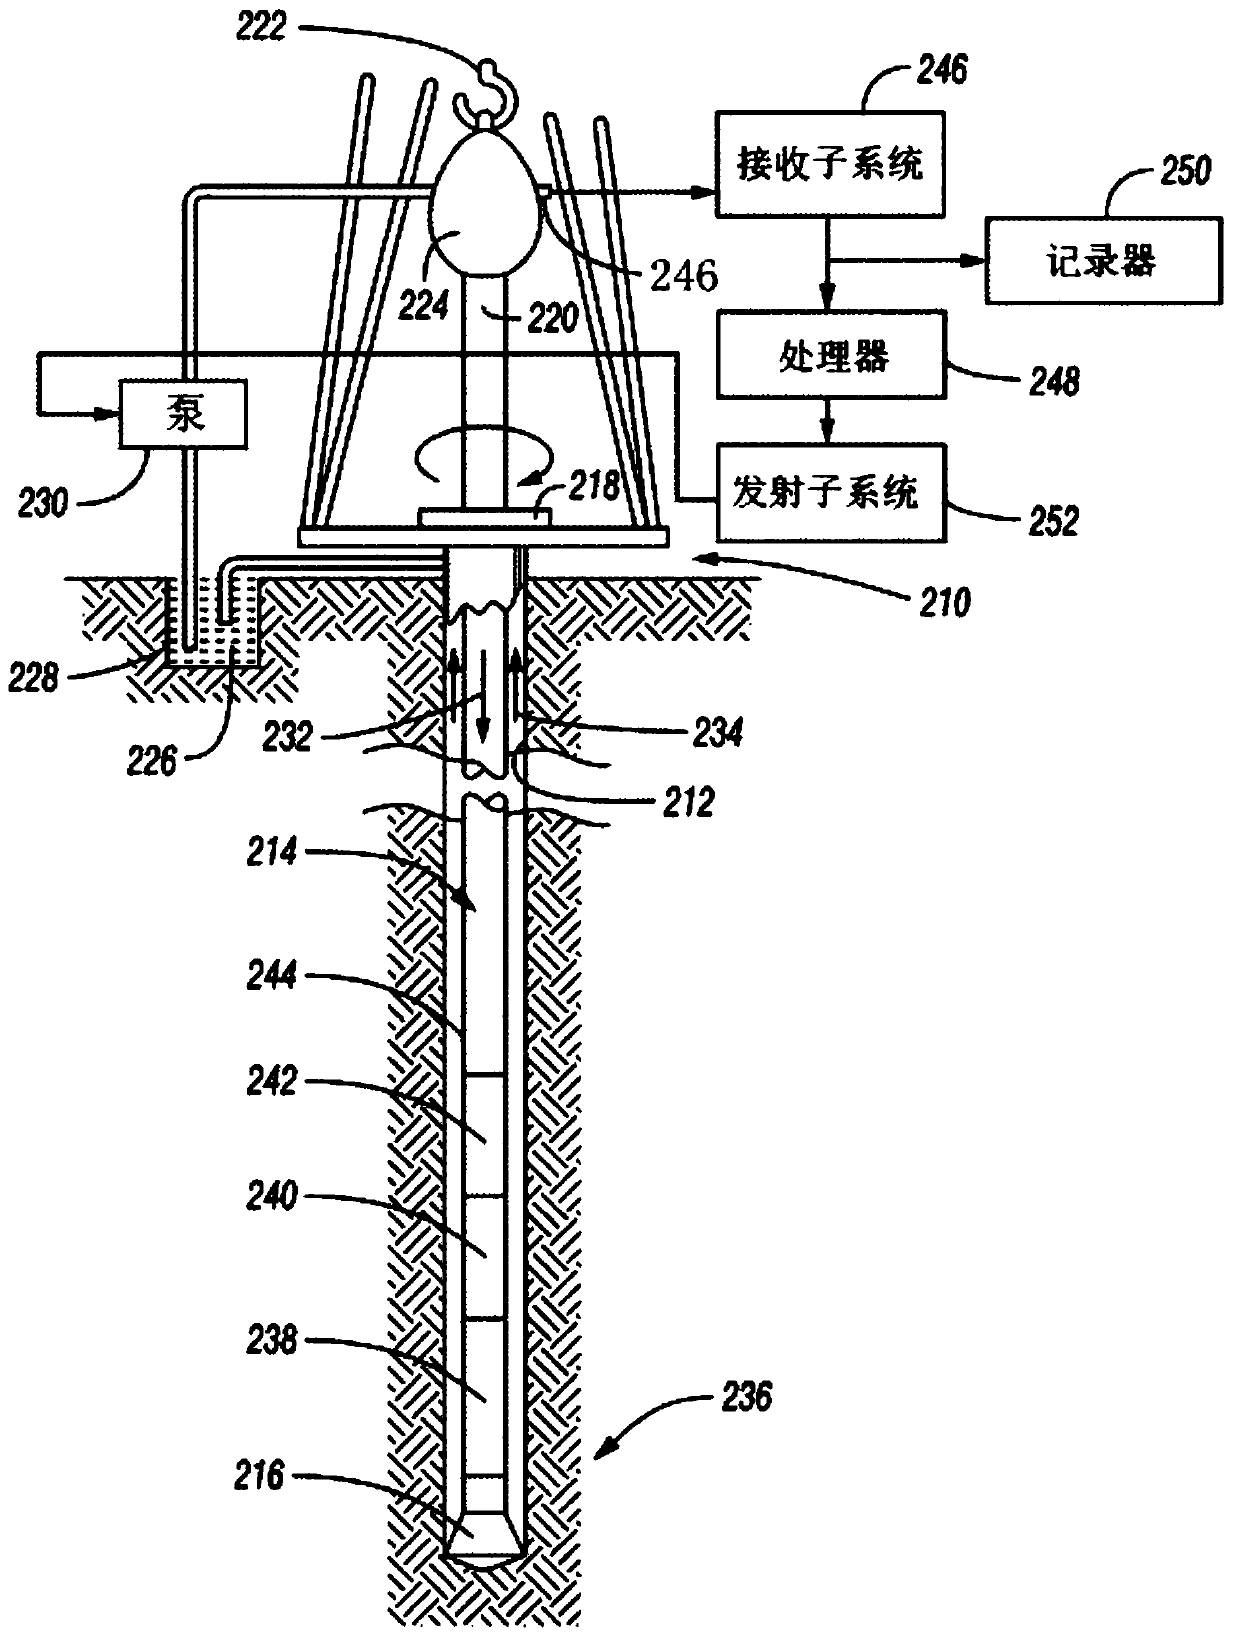
[0040] 1. A brief introduction to the drilling process in the formation and the drilling equipment used in the drilling process is as follows:
[0041] refer to figure 1, the drilling process may use a system of platforms and a derrick 210 positioned on a wellbore 212 that may be formed by rotary drilling. A drill string 214 terminating therein with a drive drill pipe 220 may be suspended within the borehole or attached to a rotary table 218 for rotating the drill bit 216 . The drill string 214 is typically hung from a hook 222 to which a moving block is attached, to which the drive drill rod 220 may be connected by a rotation 224 which allows the drill string 214 to be rotated relative to the hook 222 . Drill string 214 and drill bit 216 may also be rotated from the surface by a "top drive" type drill. The drill string 214 may also be assembled together from tubular sections ("joints" or "brackets") that are connected together.
[0042] Drilling fluid or mud 226 is in mud ...
Embodiment 2
[0057] A method for generating a visual representation of wellbore drilling parameters described in Embodiment 1 can be applied to the following situations:
[0058] 1. Applied to observe time fracture data, drilling operation parameters, and environmental parameters
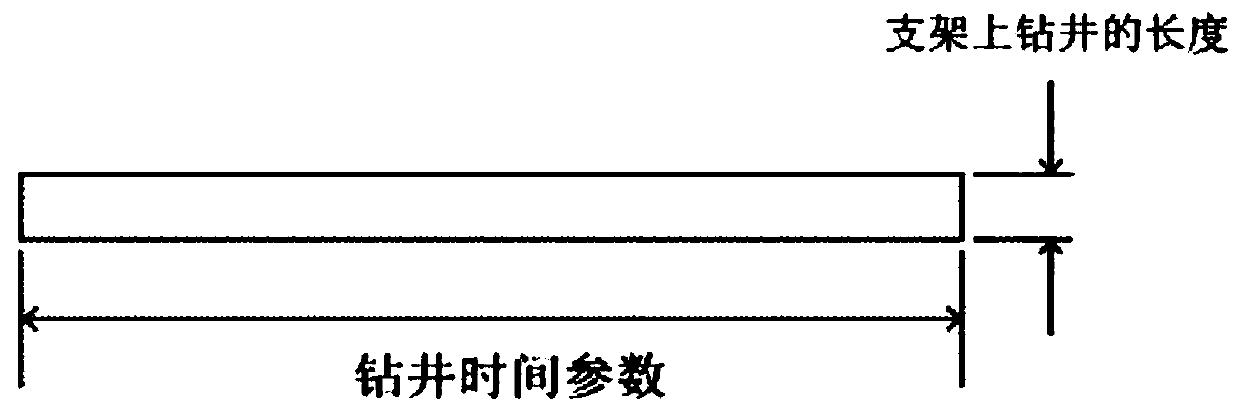
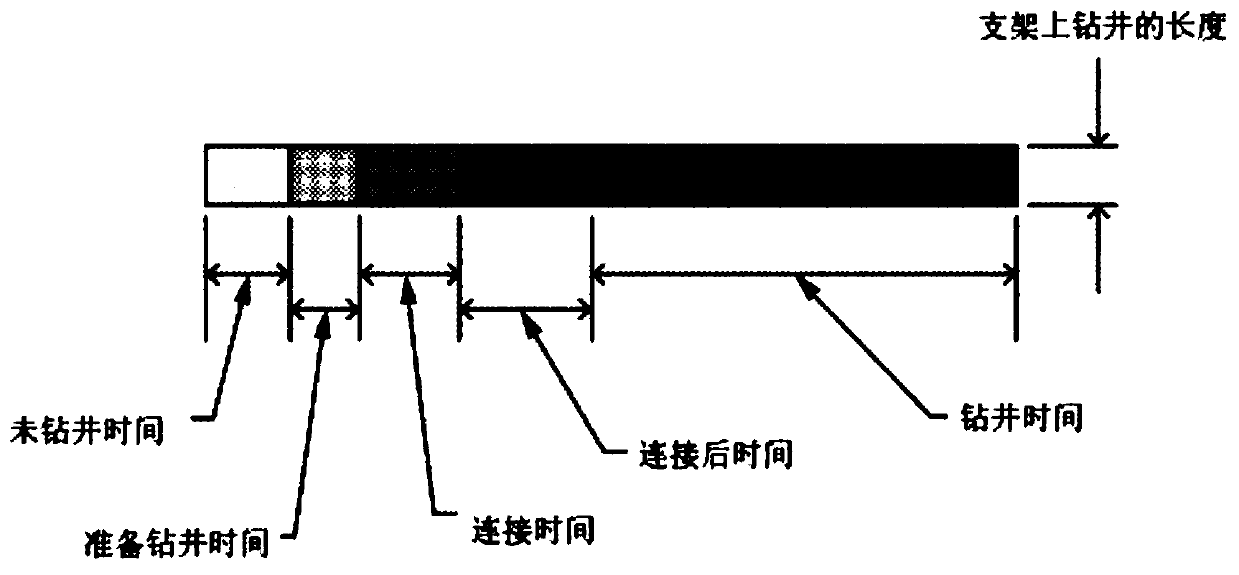
[0059] A visual representation method for generating wellbore drilling parameters is applied to draw a two-dimensional shape diagram of a predetermined wellbore length (a rectangle corresponding to a wellbore section) at an appropriate position on the time-depth curve of the well, such as Figure 5 shown. therefore, Figure 4 The x-axis of B can be converted to a plot of time in days and the axial length of the wellbore to show the progression of the time-depth curve, see Figure 4 The length of each rectangle explained by B, is multiplied by a factor to preserve relative time, rather than to make changes in each bracket visible to the analyst. Viewing time-fracture data in this way allows analysts to quickly...
PUM
 Abstract
Description
Claims
Application Information