Method for valuing oil saturation of tight sandstone

A tight sandstone and saturation technology, which is applied in the field of tight sandstone oil saturation, can solve the problems of limited exploration cost and exploration goals, and the inability to accurately calibrate and calculate reservoir oil saturation, and achieve strong operability Effect

Active Publication Date: 2020-07-03
CHINA PETROLEUM & CHEM CORP +1
View PDF8 Cites 0 Cited by
  • Summary
  • Abstract
  • Description
  • Claims
  • Application Information

AI Technical Summary

Problems solved by technology

[0002] Middle-deep tight sandstone is the key object of oil and gas exploration in continental basins in my country. However, due to the limitation of exploration cost and exploration objectives, only a small amount of conventional corin...

Method used


Image

  • Method for valuing oil saturation of tight sandstone
  • Method for valuing oil saturation of tight sandstone
  • Method for valuing oil saturation of tight sandstone

Examples


Embodiment 1

[0032] Example 1 Aiming at the value method of tight sandstone oil saturation

[0033] The method comprises the steps of:

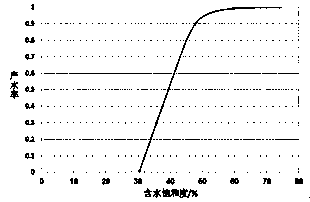
[0034] Step 1. According to the phase permeability curve, draw water production rate-water saturation relationship plate 1;

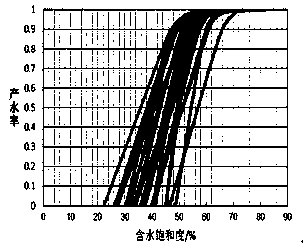
[0035] Step 2. Read the water saturation value Y corresponding to the water production rate (Fw) 0% and 90% of each sample in sequence 1 , Y 2 , denoted as Plate 2;

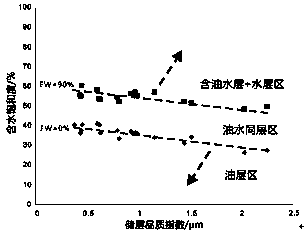
[0036] Step 3, the porosity, permeability and water saturation value Y of each sample 1 , Y 2 As a group of data; put each group of data into the intersection chart 3 where the horizontal axis is the reservoir quality index (the root of the ratio of permeability to porosity), and the vertical axis is the water saturation;

[0037] After obtaining the reservoir quality index of each sample, put the reservoir quality index corresponding to all core samples with relative permeability data, the water saturation corresponding to Fw=90% and the water saturation corresp...

Embodiment 2

[0046] Example 2 Aiming at the value method of tight sandstone oil saturation

[0047] The method comprises the steps of:

[0048] Step 1. According to the phase permeability curve, draw water production rate-water saturation relationship plate 1;

[0049] Step 2. Read the water saturation value Y corresponding to the water production rate (Fw) 0% and 90% of each sample in sequence 1 , Y 2 , denoted as Plate 2;

[0050] Step 3, take the porosity, permeability, and water saturation values ​​Y1 and Y2 of each sample as a set of data; put each set of data on the horizontal axis as the reservoir quality index (the root of the ratio of permeability to porosity ), the vertical axis is the intersection plate 3 of water saturation;

[0051] After obtaining the reservoir quality index of each sample, put the reservoir quality index corresponding to all core samples with relative permeability data, the water saturation corresponding to Fw=0% and the water saturation corresponding to F...

Embodiment 3

[0053] Example 3 The value method for oil saturation of tight sandstone

[0054] The method comprises the steps of:

[0055] Step 1. According to the phase permeability curve, draw water production rate-water saturation relationship plate 1;

[0056] Step 2. Read the water saturation value Y corresponding to the water production rate (Fw) 10% and 90% of each sample in sequence 1 , Y 2 ;

[0057] Step 3, take the porosity, permeability, and water saturation values ​​Y1 and Y2 of each sample as a set of data; put each set of data on the horizontal axis as the reservoir quality index (the root of the ratio of permeability to porosity ), and the vertical axis is water saturation in intersection panel 3

[0058] Calculate the reservoir quality index (the square root of the ratio of permeability to porosity) of each sample, and then calculate the reservoir quality index corresponding to all core samples with relative permeability data, and the water saturation corresponding to F...


PUM


Abstract

The invention relates to the field of quantitative evaluation of the saturation of a dense sandstone reservoir, in particular to a method for valuing oil saturation of tight sandstone. The method comprises the following steps of 1, drawing a water yield-water saturation relation chart 1 according to a phase infiltration curve; 2, sequentially reading water saturation values Y1 and Y2, corresponding to water yields X1 and X2, of each sample; 3, taking the porosity, permeability and water saturation values Y1 and Y2 of each sample as a set of data, and projecting each set of data to a cross plot2 taking reservoir quality index as the horizontal axis and water saturation as the vertical axis; and 4, fitting data points corresponding to the water yields X1 and X2 into straight lines, whereinthe cross plot 2 is divided into a water layer region, an oil-water same layer region and an oil layer region. By means of the method, the water saturation calculation chart based on the water yield and the reservoir quality index is established, and quantitative evaluation of the oil saturation of the reservoir is realized.

Description

technical field [0001] The invention relates to the field of quantitative evaluation of tight sandstone reservoir saturation, in particular to a method for obtaining the oil saturation of tight sandstone. Background technique [0002] Medium-deep tight sandstone is the key object of oil and gas exploration in continental basins in my country. However, due to the limitation of exploration cost and exploration objectives, only a small amount of conventional coring, oil testing and production testing are carried out on the target strata, and no sealed mining is basically designed. Cores or oil-based mud cores lead to the inability to accurately calibrate and calculate the oil saturation of the reservoir. [0003] As the main exploration object, the reserve declaration needs to be made after the reservoir is well known and the production capacity is obtained, so the accurate calculation of oil saturation parameters has become a difficult problem. How to obtain accurate reservoir...

Claims


Application Information

Patent Timeline
IPC IPC(8): E21B49/00
CPCE21B49/00Y02A10/40
Inventor 王敏傅爱兵关丽孟蕾苏国英张顺倪自高李燕张莉
Owner CHINA PETROLEUM & CHEM CORP
Why Eureka
Try Eureka