Geological data visualization method based on mixed data model

A technology of geological data and mixed data, applied in image data processing, 3D modeling, instruments, etc., can solve problems such as inability to accurately describe complex and special geological phenomena, and achieve easy display and data update, good adaptability, flexible and efficient topological relationship Effect

Active Publication Date: 2020-09-01
中冶沈勘工程技术有限公司
View PDF16 Cites 6 Cited by
  • Summary
  • Abstract
  • Description
  • Claims
  • Application Information

AI Technical Summary

Problems solved by technology

Conventional 3D geological modeling methods reduce the complexity of modeling by greatly simplifying geological conditions. They are only suitable for areas with single rock formations and simple geological structures, and cannot accurately describe complex and special geological phenomena such as faults, microstructures, and interlayers.

Method used


Image

  • Geological data visualization method based on mixed data model
  • Geological data visualization method based on mixed data model
  • Geological data visualization method based on mixed data model

Examples


Embodiment Construction

[0031] The specific implementation manners of the present invention will be further described in detail below in conjunction with the accompanying drawings and embodiments. The following examples are used to illustrate the present invention, but are not intended to limit the scope of the present invention.

[0032] The technical scheme that the present invention takes is:

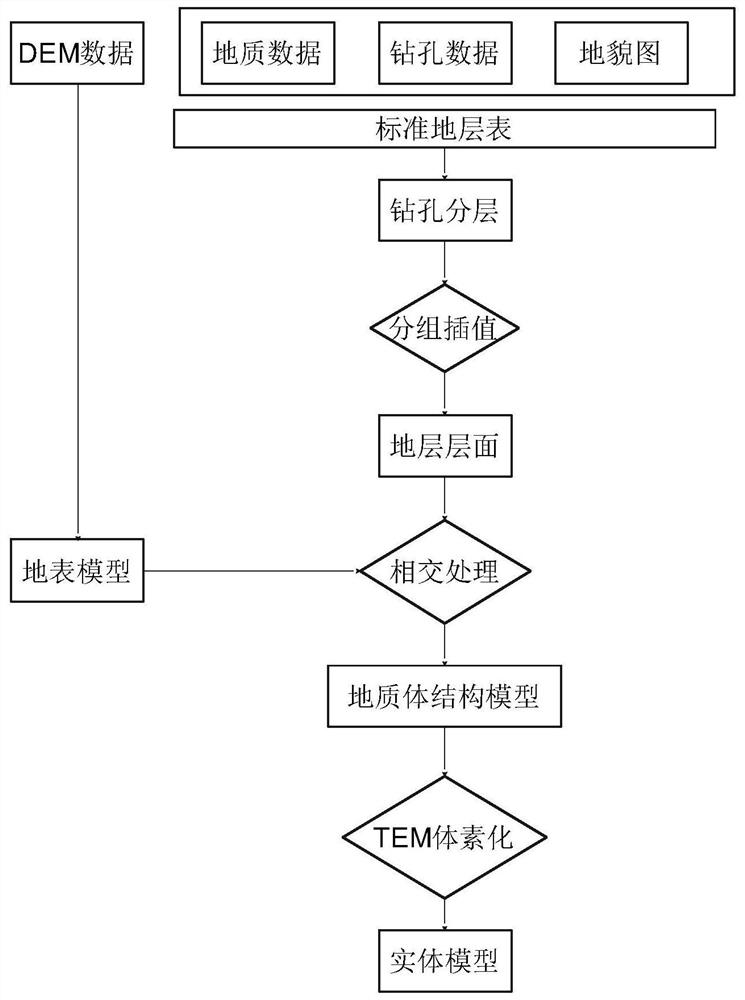
[0033] A geological data visualization method based on a hybrid data model, such as figure 1 shown, including the following steps:

[0034] Step 1: Generate the surface model; transform the 1:500 digital elevation model, 1:500 digital topographic map, discrete drilling points and engineering area line of the study area into CGCS2000 projected coordinates through format conversion and projection transformation. Drilling point P 0 As an example, the drill point data is (4623920.14, 41535946.23, 45.29), where the first digit is the north coordinate X, the second digit is the east coordinate Y, and the third...


PUM


Abstract

The invention provides a geological data visualization method based on a mixed data model, and relates to the technical field of geological survey. When a three-dimensional geologic body model constructs a three-dimensional model, an irregular tetrahedron structure TEN and triangular surface TIN mixed data model is adopted for combined modeling, the advantages of TIN and TEN are integrated by adopting a mixed data structure, the outline of a three-dimensional space entity can be rapidly formed, and display and data updating are facilitated; the boundary of the space entity is accurately expressed; efficient spatial analysis is performed, the defect of a single data structure is made up to the maximum extent, a flexible and efficient topological relation is achieved, visualization algorithms such as mapping and ray tracing can be fully utilized, and therefore the method has high universality and flexibility, the expression precision of the three-dimensional entity can be improved, the method can better adapt to the complexity of three-dimensional topology, and the method can be qualified for three-dimensional geological modeling of various different complexity degrees.

Description

technical field [0001] The invention relates to the technical field of geological survey, in particular to a visualization method for geological data based on a mixed data model. Background technique [0002] The 3D spatial data model is divided into voxel-based data models (3D grid structure, octree, irregular tetrahedron structure TEN, etc.), boundary-based data models (grid model Grid, patch structure TIN, 3D appropriate data structure, etc.), hybrid data models (Octree+TEN, TIN+CSG, Octree+TIN, object-oriented data models, etc.). The voxel-based data model is more suitable for spatial operation and spatial analysis, but the data volume is large and the operation speed is slow; the boundary surface-based data model has small data volume, which is convenient for data display and data update, but it is difficult to organize effective spatial analysis. The hybrid data model combines two or more data models, and can adapt to different resolutions, different background condit...

Claims


Application Information

Patent Timeline
Patent Type & Authority Applications(China)
IPC IPC(8): G06T17/05
CPCG06T17/05
Inventor 王夺王明宝任伟左春雷马亚敏穆星张国杰岳廷文魏可峰韦书剑任多慧王博刘九阳孙奇于跃王东明郑贺佟德军王海旭李涛吴宪营孟宪伟张国华
Owner 中冶沈勘工程技术有限公司
Why Eureka
Try Eureka