
Multi-angle line loss visual data analysis platform based on intelligent electric meter

A smart meter and data analysis technology, applied in the direction of structured data retrieval, electrical digital data processing, database distribution/replication, etc. Line loss processing and other issues, to achieve the effect of improving the application level of line loss dynamic monitoring and analysis, realizing refined operations, and improving customer experience

Pending Publication Date: 2021-03-19
李有伟
View PDF1 Cites 1 Cited by
  • Summary
  • Abstract
  • Description
  • Claims
  • Application Information

AI Technical Summary

Problems solved by technology

[0006] 3. Business: At present, the marketing management system manages the abnormal monitoring and analysis of line loss. After detecting the abnormal line loss, it needs to be processed through the abnormal processing work order, and the abnormal line loss cannot be handled conveniently.
[0007] 4. System support: The marketing management information system is a business system, which mainly meets the daily business needs of the power supply bureau. Calculation of line loss power will have a greater impact on the performance of the marketing system, resulting in poor user experience
[0009] However, this solution is still unable to realize the statistics and monitoring of daily line losses, and it is also unable to give full play to the application value of electric energy data

Method used


Image

  • Multi-angle line loss visual data analysis platform based on intelligent electric meter
  • Multi-angle line loss visual data analysis platform based on intelligent electric meter
  • Multi-angle line loss visual data analysis platform based on intelligent electric meter

Examples


Embodiment Construction

[0044] In the following, the invention will be further described in conjunction with the accompanying drawings and specific embodiments.

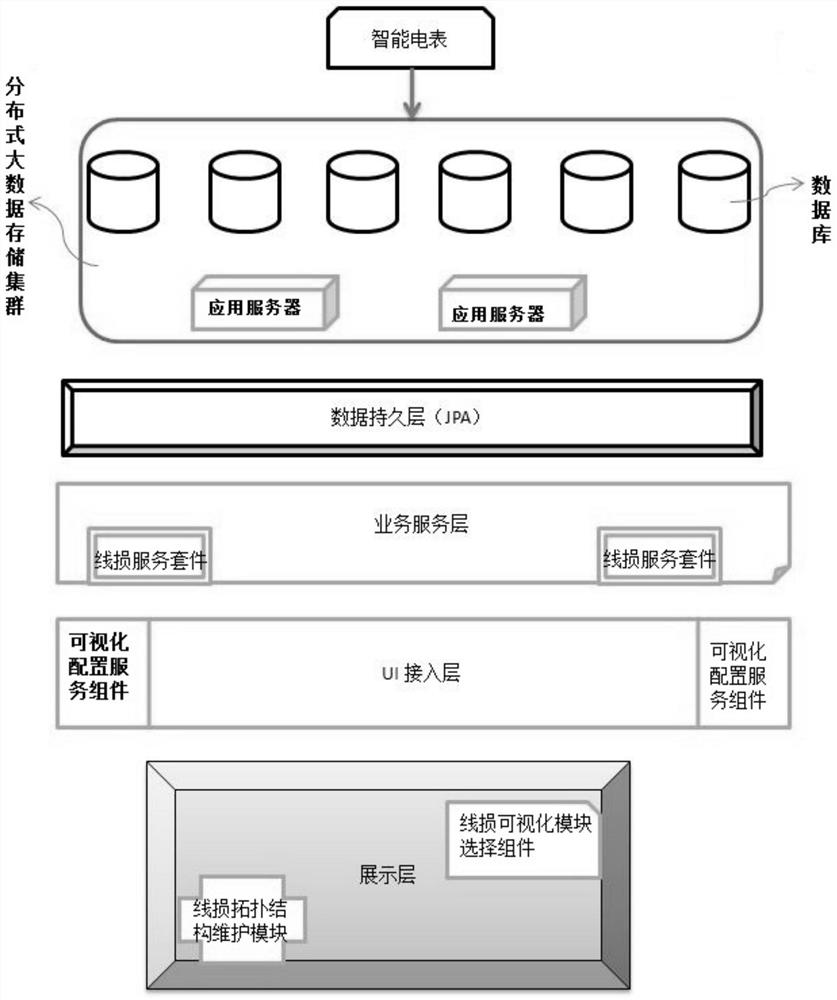
[0045] see figure 1, is a smart meter-based multi-angle line loss visualization data analysis platform according to an embodiment of the present invention.

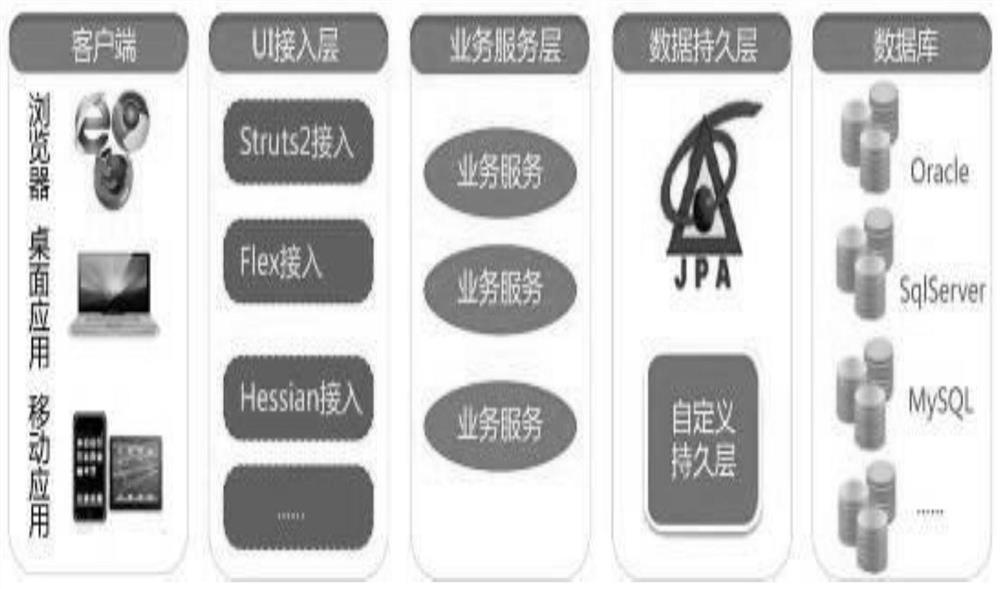
[0046] exist figure 1 Among them, the visual data analysis and analysis platform includes a client, a UI access layer, a business service layer, a data persistence layer, and multiple databases.

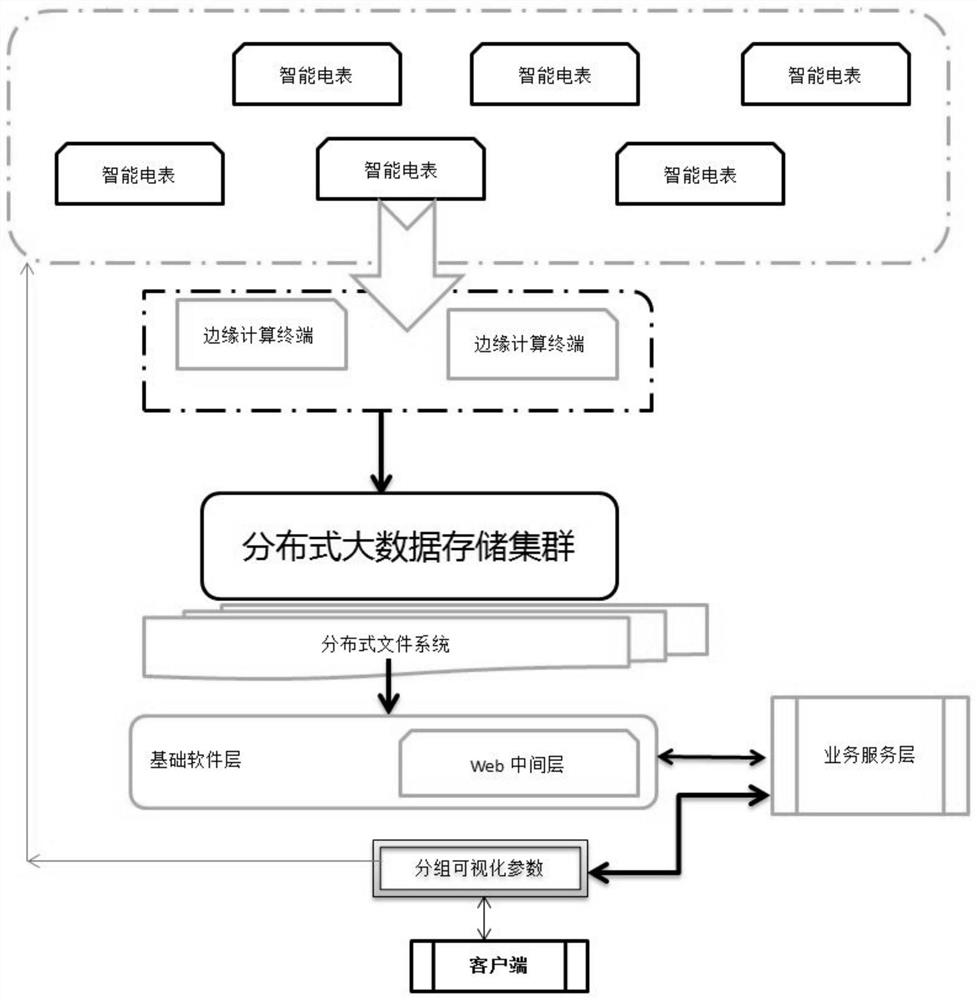
[0047] The multiple databases are connected to application servers to form a distributed big data storage cluster; the business service layer provides a big data service suite, and the big data service suite includes a line loss data integration suite, a line loss data management suite, a line loss data management suite, and a line loss data management suite. Query statistics package, line loss numerical analysis package and line loss data mining package.

[0048] The client includes a dis...


PUM


Abstract

The invention provides a multi-angle line loss visual data analysis platform based on an intelligent electric meter. The multi-angle line loss visual data analysis platform comprises a client, a UI access layer, a business service layer, a data persistence layer and a plurality of databases. The intelligent electric meter is used for acquiring massive power utilization information and storing theinformation into the plurality of databases; the business service layer provides a big data service suite UI access layer with a visual configuration service component, and the visual configuration service component sets grouping visual parameters; the client selects an assembly through the line loss visualization module, and executes multi-angle line loss visualization data analysis; the multi-angle line loss visual data analysis comprises subarea statistics line loss, voltage division statistics line loss, line statistics line loss, transformer area statistics line loss, synchronous line loss, subarea synchronous line loss, voltage division synchronous line loss, sub-element synchronous line loss, sub-line synchronous line loss and sub-transformer area synchronous line loss. Through thestatistics and monitoring of the line loss, the multi-angle line loss visual data analysis platform improves the lean and informationized management level of the line loss, and gives play to the application value of the electric energy data.

Description

technical field [0001] The invention belongs to the technical field of power grid line loss analysis, in particular to a multi-angle line loss visualization data analysis platform based on a smart meter. Background technique [0002] At present, for the management of line loss, the cycle is calculated on a monthly basis, which is difficult to meet the requirements of lean management. The business operating system that has been built focuses on business operations, lacks the support of intelligent technology and big data analysis capabilities, and is difficult to meet the needs of high-level customer service management. [0003] Specifically reflected in: [0004] 1. Working method: Calculate the line loss once a month, then analyze and process the line loss abnormality, and the processing cycle is long. If there are users who read meters in single and even months, the processing cycle is two meter reading cycles, which is too long. [0005] 2. In terms of business managem...

Claims


Application Information

Patent Timeline
Patent Type & Authority Applications(China)
IPC IPC(8): G06F16/2458G06F16/248G06F16/27G06F16/25G06F16/215G06F9/50
CPCG06F9/5027G06F2209/502G06F16/215G06F16/2462G06F16/2465G06F16/248G06F16/254G06F16/27
Inventor 李有伟
Owner 李有伟
Learn More