

River light pollution index extraction method based on noctilucent remote sensing image
A technology of remote sensing image and extraction method, which is applied in image data processing, image enhancement, image analysis, etc., and can solve problems such as pollution
- Summary
- Abstract
- Description
- Claims
- Application Information
AI Technical Summary
Problems solved by technology
Method used
Image

Examples
Embodiment 1
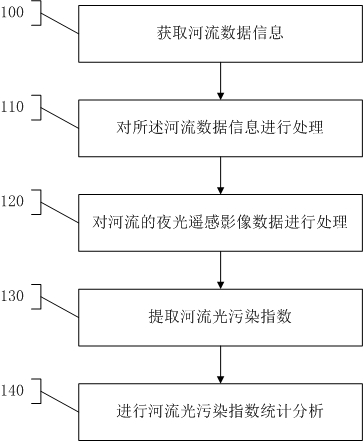
[0036] Such as figure 1 As shown, a method for extracting river light pollution index based on nighttime light remote sensing images, step 100 is executed to obtain river data information. The river data information includes the large-scale river data of the linear layer and the night light remote sensing image data of the river.
[0037] Execute step 110 to process the river data information, including the following sub-steps: Step 11: Divide the same river in different administrative regions of the process into multiple river sections based on the principle of dividing administrative regions; Step 12: Use GIS software Make buffers for each of the rivers, resulting in an areal flow layer.
[0038] Step 120 is executed to process night light remote sensing image data of the river. The step 2 includes the following sub-steps: Step 21: uniformly modify some specific feature values in the luminous remote sensing images to 0, such as "-9999", "-999" and so on; Step 22: stitch ...
Embodiment 2
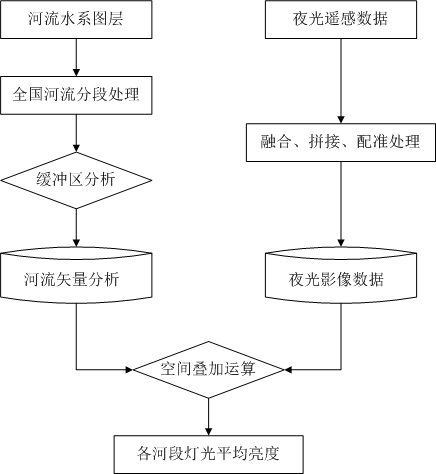
[0042] This paper proposes a river light pollution index extraction method based on nighttime light remote sensing images. Firstly, the river is segmented and buffered, and the river line layer is converted into a surface layer; at the same time, the Luojia remote sensing image is registered and spliced. processing to form a complete image; then use the spatial statistics method to count the average light brightness in each river buffer area; finally associate the average value with the river layer properties to form a river light pollution index map. Technical route such as figure 2 shown.
[0043] (1) River data processing
[0044] At present, the large-scale river data is mainly a linear layer, and each river is an independent vector line. However, due to the fact that many rivers flow through a wide range, the characteristics of different river sections are different, such as the economic level of the upper reaches, middle reaches, and lower reaches of the Yangtze River...
Embodiment 3
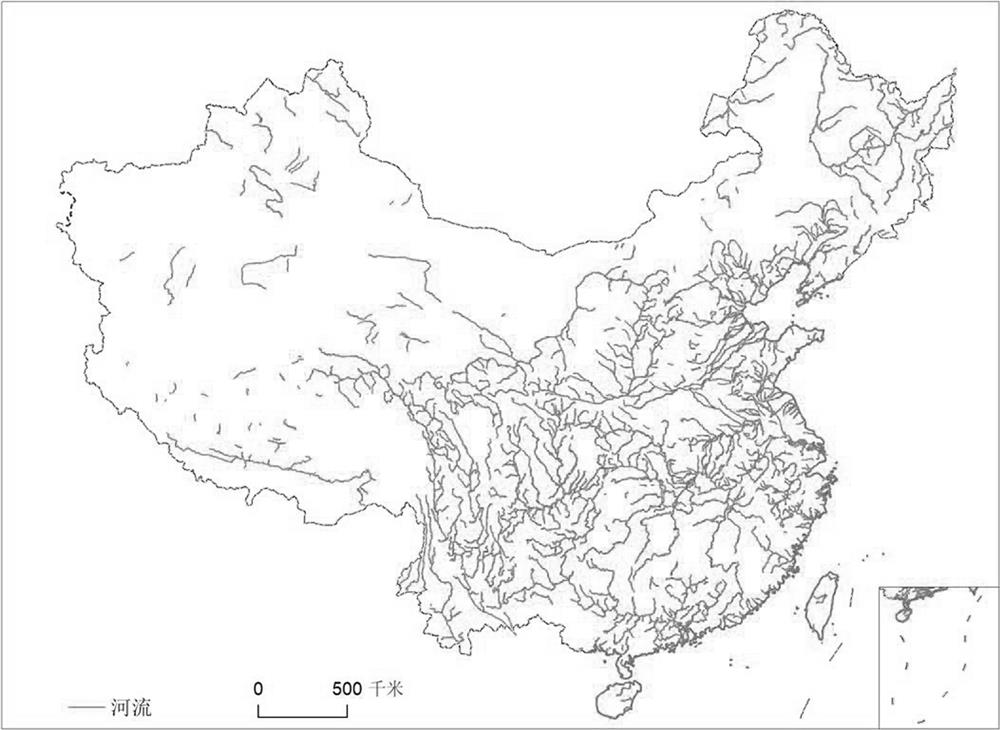
[0053] In this example, the national 1:250,000 river layer and the 2019 VRIIS luminous remote sensing images were selected for analysis.
[0054] The effect of the river layer after segmentation and buffering is as follows image 3 As shown in , the river in the figure is represented by a curve. If a river crosses more than two administrative regions, the river will be segmented according to the boundaries of the administrative regions to form river segments.
[0055] After making the river buffer zone, the partial enlarged effect picture is as follows Figure 4 As shown, according to the segmented river segment, the buffer zone of each river segment is made according to 500 meters on each side to form a buffer layer.
[0056] The effect picture after mosaic of luminous remote sensing is as follows Figure 5 As shown in , a complete tif image is formed after splicing the luminous remote sensing data, and the value of each pixel in the image is the brightness value of the lig...
PUM
 Abstract
Description
Claims
Application Information