Economic design method for variable sampling interval and sample capacity EWMA control chart under non-normal distribution
A technique of sample size and normal distribution, applied in computing, market forecasting, marketing, etc., which can solve problems such as skewness of observations and economic design of EWMA control charts that are not taken into account at the same time.
- Summary
- Abstract
- Description
- Claims
- Application Information
AI Technical Summary
Problems solved by technology
Method used
Image
Examples
Embodiment Construction
[0087] DETAILED DESCRIPTION OF THE PREFERRED EMBODIMENTS
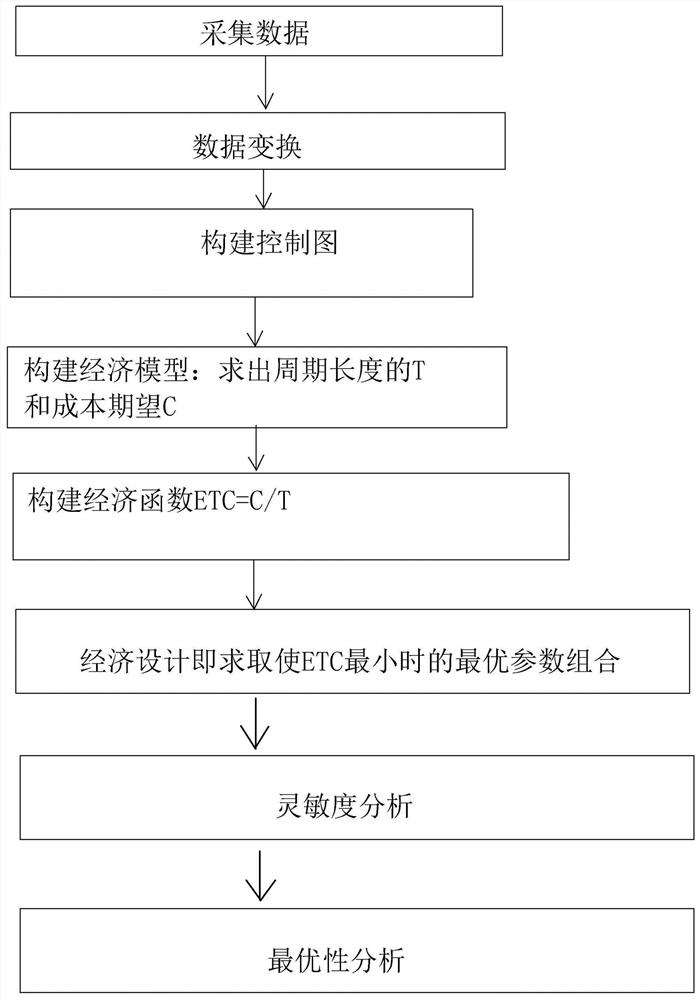
[0088] First, the economic design method of the VSSI non-state EWMA control diagram, which includes the following steps:
[0089] Step 1: Collect data. Using the data acquisition device to collect non-normal data in industrial production, and use X to indicate the observed value variable, the mean and standard differences of the observation value are μ and σ.
[0090] Step 2: Data Transformation. Since the distribution of data is unknown, it is necessary to determine the distribution function via the Burr change, set the BURR variable as Y, in the next step, the following conversion rules are taken between the variables x and y:
[0091] (1) The polarization coefficient of X is calculated by the following formula. 3 Peak factor alpha 4 :
[0092]
[0093] (4) Found with α in the BURR distribution table 3 Alpha 4 The corresponding Burr parameter C and Q (C and Q are constant greater than 1), thereby determining the corres...
PUM
 Abstract
Description
Claims
Application Information
 - R&D
- Intellectual Property
- Life Sciences
- Materials
- Tech Scout
- Unparalleled Data Quality
- Higher Quality Content
- 60% Fewer Hallucinations
Browse by: Latest US Patents, China's latest patents, Technical Efficacy Thesaurus, Application Domain, Technology Topic, Popular Technical Reports.
© 2025 PatSnap. All rights reserved.Legal|Privacy policy|Modern Slavery Act Transparency Statement|Sitemap|About US| Contact US: help@patsnap.com


