Dust concentration sensor calibration method

A dust concentration and calibration method technology, applied in the direction of instruments, scientific instruments, material weighing, etc., can solve the problems of frequent calibration, sensor local value changes, large errors, etc., to eliminate the interference of zero point, improve detection accuracy, and calibrate the results stable effect

Active Publication Date: 2021-09-17
CHINA COAL TECH ENG GRP CHONGQING RES INST
View PDF22 Cites 0 Cited by
  • Summary
  • Abstract
  • Description
  • Claims
  • Application Information

AI Technical Summary

Problems solved by technology

[0003]During the field application of the dust sensor, due to factors such as differences in dust types and changes in the external physical field, it is necessary to modify the calibration coefficient of the sensor. The current method is Directly modify the calibration coefficient, but it will cause the discontinuity of the sensor monitoring value, and then there will be problems of unstable monitoring results and large errors
[0004] On the other hand, due to differences in the stability of the DC power supply at the site, the interference of the surrounding electromagnetic field, and the grounding conditions at the site, the local value of the sensor changes, and this The bottom value is not a fixed value, but a fluctuating value within a certain range. The fluctuation of the background value has a great influence on the monitoring accuracy of low concentration
At present, the background value of the sensor is directly modified for the background value, that is, the electrical signal of the sensor is directly subtracted from the fixed background value, and then calibrated according to the calibration coefficient. The existing problem is that frequent calibration is required, and the background value is continuously modified to increase On-site sensor maintenance work; and the low concentration monitoring results of the sensor fluctuate greatly and have large errors

Method used


Image

  • Dust concentration sensor calibration method
  • Dust concentration sensor calibration method
  • Dust concentration sensor calibration method

Examples


Embodiment Construction

[0026] Embodiments of the present invention are described below through specific examples, and those skilled in the art can easily understand other advantages and effects of the present invention from the content disclosed in this specification. The present invention can also be implemented or applied through other different specific implementation modes, and various modifications or changes can be made to the details in this specification based on different viewpoints and applications without departing from the spirit of the present invention. It should be noted that the diagrams provided in the following embodiments are only schematically illustrating the basic concept of the present invention, and the following embodiments and the features in the embodiments can be combined with each other in the case of no conflict.

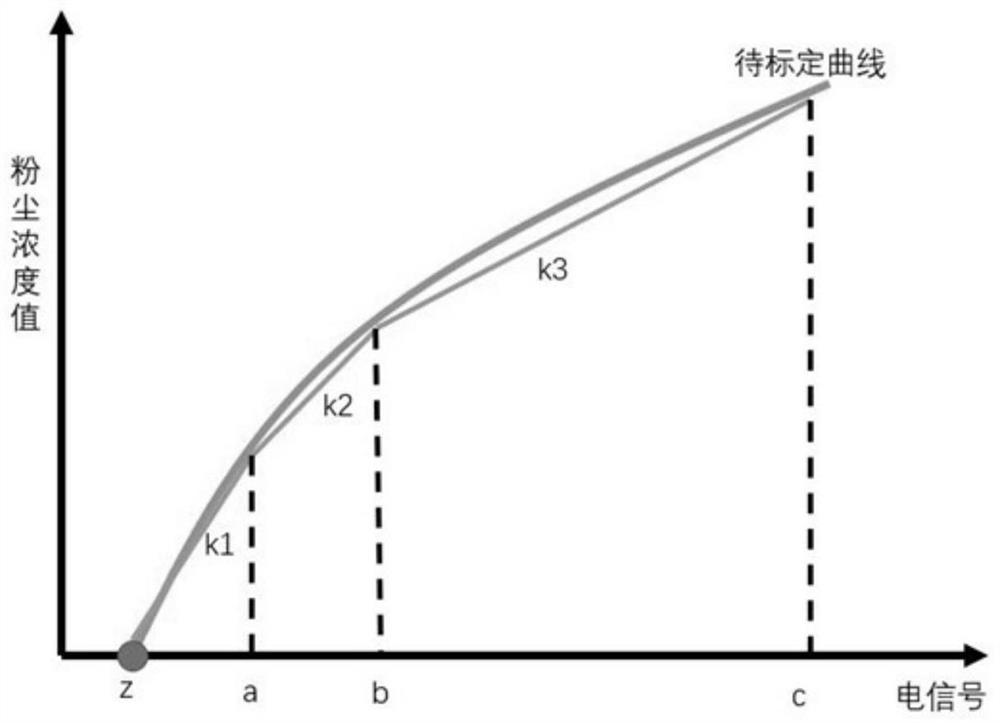
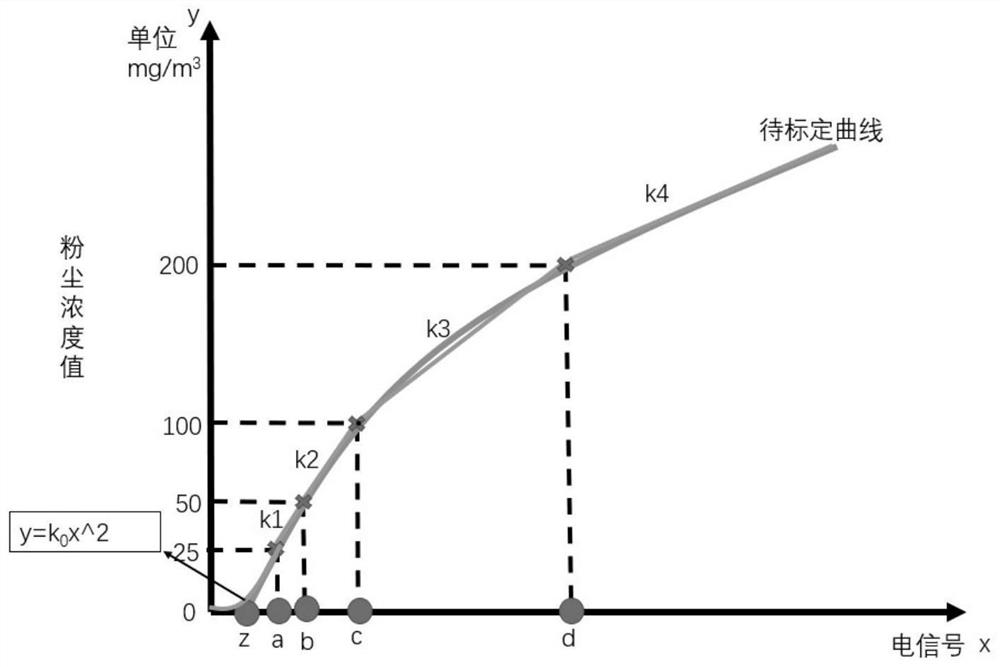
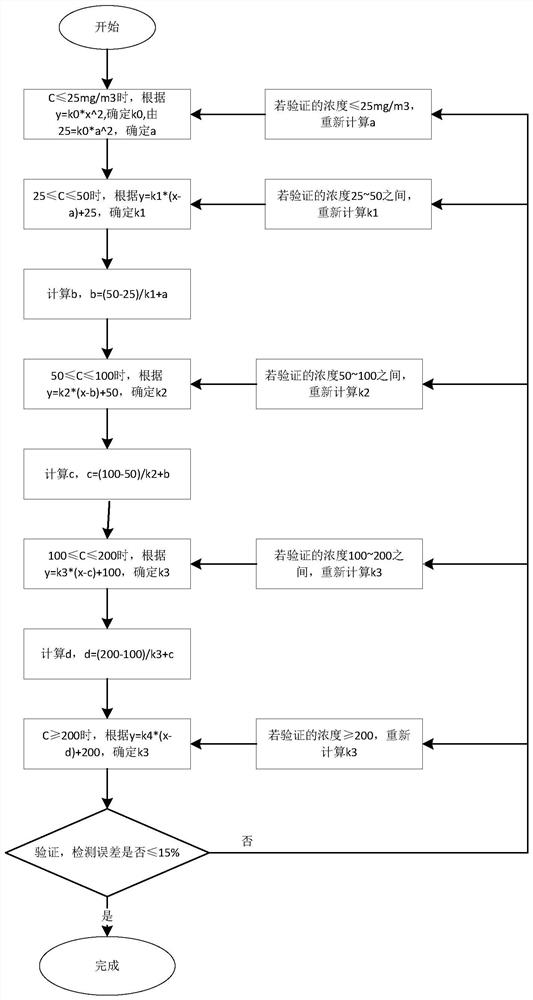
[0027] see Figure 2 ~ Figure 3 , the present invention designs a kind of dust concentration sensor calibration method, specifically comprises the following ...


PUM


Abstract

The invention relates to a dust concentration sensor calibration method, which belongs to the technical field of dust concentration detection. The method comprises the following steps of S1, collecting an electric signal generated by dust by using a detector, S2, acquiring the actual dust concentration through weighing and sampling, S3, comparing the value of the electric signal with the value of the actual dust concentration to determine a curve relation between the value of the electric signal and the value of the dust concentration, S4, according to the curve determined in the step S3, respectively acquiring electric signal values a-e corresponding to dust concentration values of 25, 50, 100, 200 and 1000 mg / m<3>, and S5, respectively calibrating the curves of five segments of 0 to 25 mg / m<3>, 25 to 50 mg / m<3>, 50 to 100 mg / m<3>, 100 to 200 mg / m<3> and 200 to 1000mg / m<3>. Rapid calibration can be realized, a calibration curve is continuous, and the influence of a background value on a low-concentration detection result is reduced; the interference of a zero point is eliminated, and the low-concentration detection precision is improved.

Description

technical field [0001] The invention belongs to the technical field of dust concentration detection and relates to a method for calibrating a dust concentration sensor. Background technique [0002] The dust concentration sensor can realize the online monitoring of the dust concentration, and transmit the monitoring results to the monitoring center or terminal equipment in real time. Universal application. The dust sensor is an indirect measurement of the dust concentration. The principle of the dust concentration sensor is the effect of dust particles on the external physical field. An electrical signal is generated on the detector. The strength of the electrical signal is positively correlated with the dust concentration. Then, by comparing The numerical value of the electrical signal and the actual dust concentration value (the actual dust concentration value is calculated by weighing and sampling), determine the curve relationship between the electrical signal and the d...

Claims


Application Information

Patent Timeline
IPC IPC(8): G01N15/06G01N5/00
CPCG01N15/0656G01N5/00
Inventor 陈建阁李德文吴付祥刘国庆王杰路思远张强惠立锋焦敏李征真罗小博晏丹邓勤王宇廷柳玉磊张安然孙中光
Owner CHINA COAL TECH ENG GRP CHONGQING RES INST
Why Eureka
Try Eureka