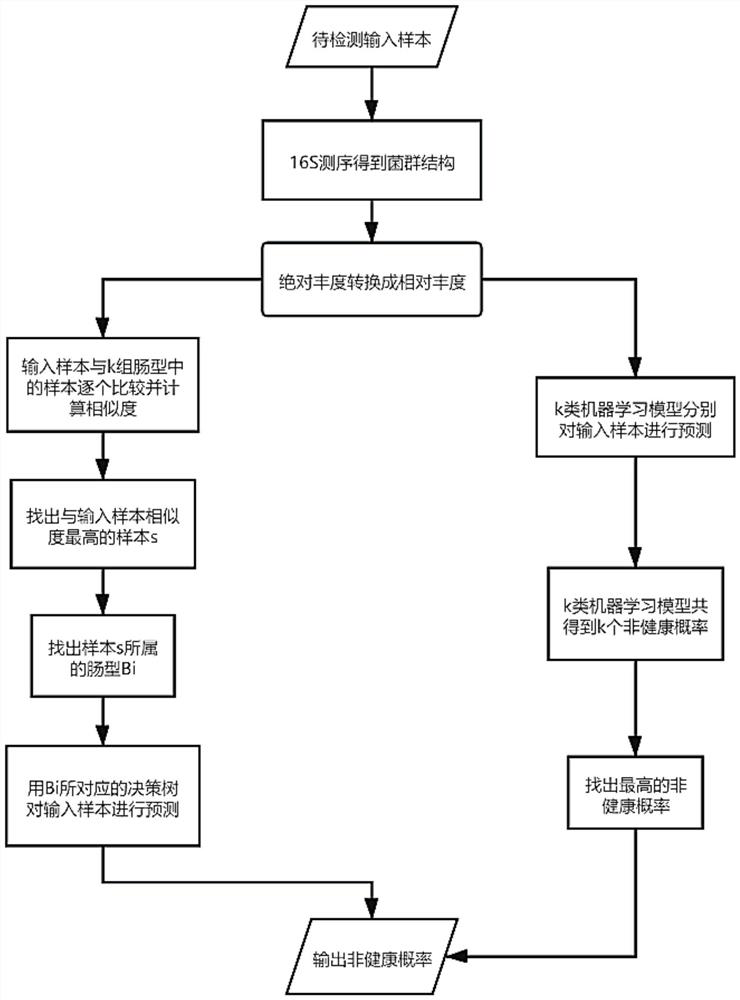
An intestinal microecology differential bacteria classification processing method and an intestinal health assessment method
A technology of intestinal microecology and processing method, which is applied in the field of intestinal microbial data analysis and processing, can solve the problems of wide distribution and strong interference of intestinal flora data, and achieve the effect of meeting application requirements and strong anti-interference performance
- Summary
- Abstract
- Description
- Claims
- Application Information
AI Technical Summary
Problems solved by technology
Method used
Image
Examples
Embodiment 1
[0034] In this embodiment, the step S10 mainly realizes the digital processing process of the sample features.
[0035] For the step S10, it is necessary to collect A data first, including n samples in total, including the non-healthy sample DG marked by industry experts and the control group sample CG, wherein the number of samples of the non-healthy sample DG is n1, and the sample number of the control group is n1. The number of samples of CG is n2, note that the values of n1 and n2 are close, and there is n=n1+n2. Sample characteristics are composed of the basic information of the sample and the absolute abundance of intestinal flora (OTU characteristics) obtained after 16S sequencing, and each sample includes at most m characteristics.
[0036] In the step S10, the characteristics of the n samples are first arranged into a matrix, each row of the matrix is composed of a sample characteristic, and the sample characteristics are expressed as: number+age+sampling address+...
Embodiment 2
[0039] In this embodiment, the step S11 mainly realizes the format conversion and filtering functions of the digitized features.
[0040] For the step S11, a format conversion step and a step of screening out low-abundance features are further included:
[0041] For the format conversion step, the relative abundance of the flora is the ratio of the abundance of a certain flora in the specified sample to the sum of the abundances of all the flora in the sample. Therefore, in the step S11, the absolute Abundance is converted to relative abundance:
[0042] Set the abundance of a certain bacterial group in the sample as R ij , the non-healthy group DG or the control group CG have n1 or n2 samples respectively, and each sample has m features, then the relative abundance of the jth feature in the ith sample is:
[0043]
[0044] Based on the above calculation method, the digital characteristics of each sample were converted from absolute abundance to relative abundance.
[00...
Embodiment 3
[0049] In this embodiment, the step S12 is a sample similarity clustering process.
[0050] For the step S12, it involves the sample similarity clustering process: first, all samples in the sample A set are divided into multiple categories according to the similarity of OTU features, and samples with high similarity are classified into the same category, and are divided into k categories in total. types, and each intestinal type contains multiple samples.
[0051] Further, in the step S12, samples x:[x 1 ,x 2 ,...,x i ,...,x m ] and sample y:[y 1 ,y 2 ,...,y i ,...y m ], use the following formula to calculate the similarity sim of sample x and sample y:
[0052]
[0053] Among them, it is known that the sample set A contains a large number of samples with the same structure as x or y, and the method of data clustering can be used, that is, the samples are divided into multiple groups by calculating the similarity between two samples, and the samples with high simila...
PUM
 Abstract
Description
Claims
Application Information
 - R&D
- Intellectual Property
- Life Sciences
- Materials
- Tech Scout
- Unparalleled Data Quality
- Higher Quality Content
- 60% Fewer Hallucinations
Browse by: Latest US Patents, China's latest patents, Technical Efficacy Thesaurus, Application Domain, Technology Topic, Popular Technical Reports.
© 2025 PatSnap. All rights reserved.Legal|Privacy policy|Modern Slavery Act Transparency Statement|Sitemap|About US| Contact US: help@patsnap.com


