A Vibration Data Cleaning Method Based on Interval Standard Deviation Combined with Spectrum Analysis

A spectrum analysis and vibration data technology, applied in electrical digital data processing, special data processing applications, testing of machine/structural components, etc. fast effect

Active Publication Date: 2021-12-14
BEIJING AEROSPACE ZHIKONG MONITORING TECH INST
View PDF5 Cites 0 Cited by
  • Summary
  • Abstract
  • Description
  • Claims
  • Application Information

AI Technical Summary

Problems solved by technology

[0010] In order to solve the problems of low robustness and poor real-time performance of the traditional abnormal point detection algorithm, the present invention proposes a vibration data cleaning method based on interval standard deviation combined with spectrum analysis. The method calculates and compares the samples of each sub-region of the original vibration signal Standard deviation, combined with fast Fourier transform spectral correlation analysis of two adjacent intervals to identify abnormal signals online and reduce the interference of abnormal signals on subsequent fault diagnosis

Method used


Image

  • A Vibration Data Cleaning Method Based on Interval Standard Deviation Combined with Spectrum Analysis
  • A Vibration Data Cleaning Method Based on Interval Standard Deviation Combined with Spectrum Analysis
  • A Vibration Data Cleaning Method Based on Interval Standard Deviation Combined with Spectrum Analysis

Examples


Embodiment 1

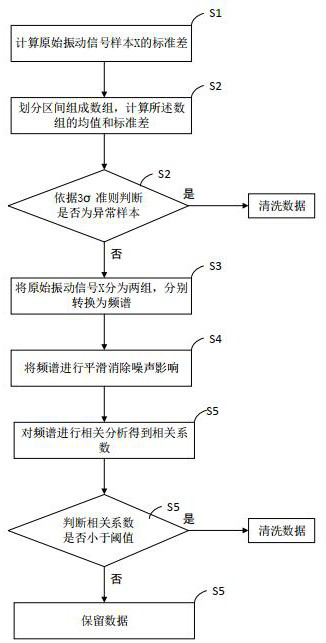
[0105] Such as figure 1 As shown, a vibration data cleaning method based on interval standard deviation combined with spectrum analysis includes the following steps:

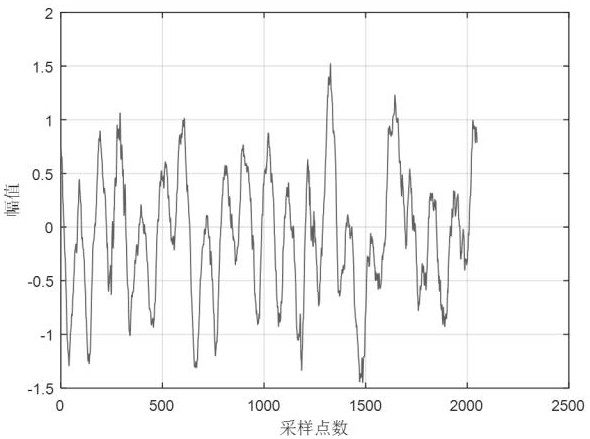
[0106] S1. Calculate the standard deviation of the original vibration signal sample X;

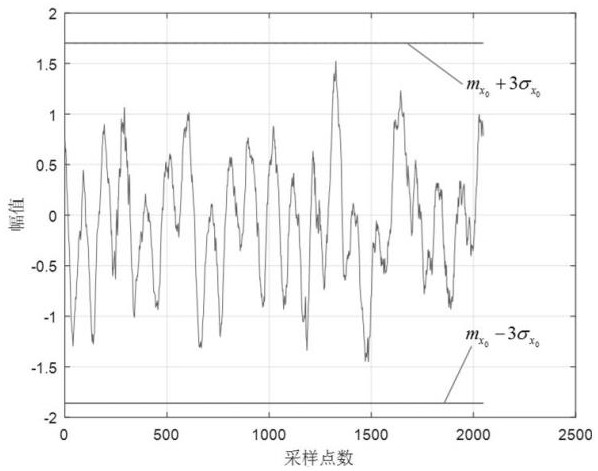
[0107] S2. Calculate the periodic data length of the original vibration signal sample X according to the equipment speed, multiplier, and sampling frequency and divide the intervals to form an array, calculate the mean value and standard deviation of the array, and judge whether the original vibration signal sample X is an abnormal sample according to the 3σ rule. If it is judged to be yes, perform cleaning, if it is judged to be otherwise, go to step S3;

[0108] S3. Divide the original vibration signal sample X into two groups, and convert them into frequency spectra respectively;

[0109] S4, smoothing the frequency spectrum to eliminate noise influence;

[0110] S5. Carry out correlation analysis on the frequency spec...

Embodiment 2

[0112] Such as figure 1 As shown, a vibration data cleaning method based on interval standard deviation combined with spectrum analysis includes the following steps:

[0113] S1. Calculate the standard deviation of the original vibration signal sample X;

[0114] Original vibration signal sample X standard deviation for:

[0115] ,

[0116] Among them, the original vibration signal sample X is , L is the number of sampling points of the original vibration signal sample X, is the average value of the original vibration signal sample X;

[0117] ;

[0118] S2. Calculate the periodic data length of the original vibration signal sample X according to the equipment speed, multiplier, and sampling frequency and divide the intervals to form an array, calculate the mean value and standard deviation of the array, and judge whether the original vibration signal sample X is an abnormal sample according to the 3σ rule. If it is judged to be yes, perform cleaning, if it is ju...

Embodiment 3

[0143] A vibration data cleaning method based on interval standard deviation combined with spectrum analysis, comprehensively judges whether the sample is an abnormal sample point through probability statistics and spectrum correlation analysis (assuming that the number of sampling points of the sample is L = 2048, and the sampling frequency is 2.56KHz ): . Given a correlation coefficient threshold .

[0144] (1) Calculate the original sample X standard deviation: ;

[0145] (2) Set interval points according to the equipment rotation speed: In this example, assuming that the equipment rotation speed is 3000 rpm, the corresponding multiplier frequency of the equipment is 3000 / 60=50Hz. According to the vibration signal sampling frequency of 2.56k Hz, the calculated data length of one period of the signal is: N = 2.56*1000 / 50 ≈ 51;

[0146] (3) Divide the original sample into 40 intervals ( L / N = 2048 / 51 ≈ 40 In order to ensure the timeliness of calculation, adjacent int...


PUM


Abstract

The invention provides a vibration data cleaning method based on interval standard deviation combined with spectrum analysis, calculates the standard deviation of the original vibration signal sample X and divides the interval into an array, calculates the mean value and standard deviation of the array, and judges whether the original vibration signal sample X is Abnormal samples, if they are abnormal samples, they will be cleaned. If they are normal samples, the original vibration signal samples X will be divided into two groups and converted into frequency spectra respectively; the frequency spectrum will be smoothed to eliminate the influence of noise; correlation analysis will be performed on the frequency spectrum to obtain the correlation coefficient, if If the correlation coefficient is less than the threshold value, the original vibration signal sample X is an abnormal sample, which is cleaned; if the correlation coefficient is greater than or equal to the threshold value, then the original vibration signal sample X is a normal sample, which is retained. The present invention calculates and compares the sample standard deviation of each sub-region of the original vibration signal, and combines the fast Fourier transform spectrum correlation analysis of two adjacent intervals to identify abnormal signals online, reducing the interference of abnormal signals to subsequent fault diagnosis.

Description

technical field [0001] The invention relates to the technical field of measurement and testing, in particular to a vibration data cleaning method based on interval standard deviation combined with frequency spectrum analysis. Background technique [0002] In equipment predictive maintenance, vibration signal-based analysis is one of the most widely used fault monitoring methods. At present, the focus of research in this field is mainly on data collection, mining and analysis, while ignoring the hidden dangers brought by data quality. Due to complex factors such as changing external working conditions and failures of acquisition devices, the collected vibration data often has quality problems such as missing data, redundant information, and data errors, which will directly affect the results of subsequent data analysis and greatly reduce the Data Availability. Data anomaly removal (data cleaning) as a data preprocessing tool can identify the wrong data in the collected vibr...

Claims


Application Information

Patent Timeline
Patent Type & Authority Patents(China)
IPC IPC(8): G06K9/00G06K9/62G06F17/14G06F17/18G01M99/00
CPCG06F17/142G06F17/18G01M99/005G06F2218/12G06F18/2433G06F18/10
Inventor 胡勇彭六保曾志生
Owner BEIJING AEROSPACE ZHIKONG MONITORING TECH INST
Why Eureka
Try Eureka