Method for generating electrocortical potential nonlinear trend diagram used in real-time monitoring

A nonlinear and nonlinear dynamic technology, applied in electrical digital data processing, special data processing applications, instruments, etc., can solve the problems of lack of long-term process and difficult real-time analysis.

Inactive Publication Date: 2005-01-19
XUANWU HOSPITAL OF CAPITAL UNIV OF MEDICAL SCI
View PDF0 Cites 18 Cited by
  • Summary
  • Abstract
  • Description
  • Claims
  • Application Information

AI Technical Summary

Problems solved by technology

At present, due to the complex analysis of a large amount of data required for nonlinear dynamic analysis, it is difficult to achieve real-time analysis, and there is also a lack of analysis methods that reflect long-term processes in real time

Method used


Image

  • Method for generating electrocortical potential nonlinear trend diagram used in real-time monitoring
  • Method for generating electrocortical potential nonlinear trend diagram used in real-time monitoring
  • Method for generating electrocortical potential nonlinear trend diagram used in real-time monitoring

Examples


Embodiment Construction

[0033] The present invention will be further described in detail below in conjunction with the accompanying drawings and specific embodiments.

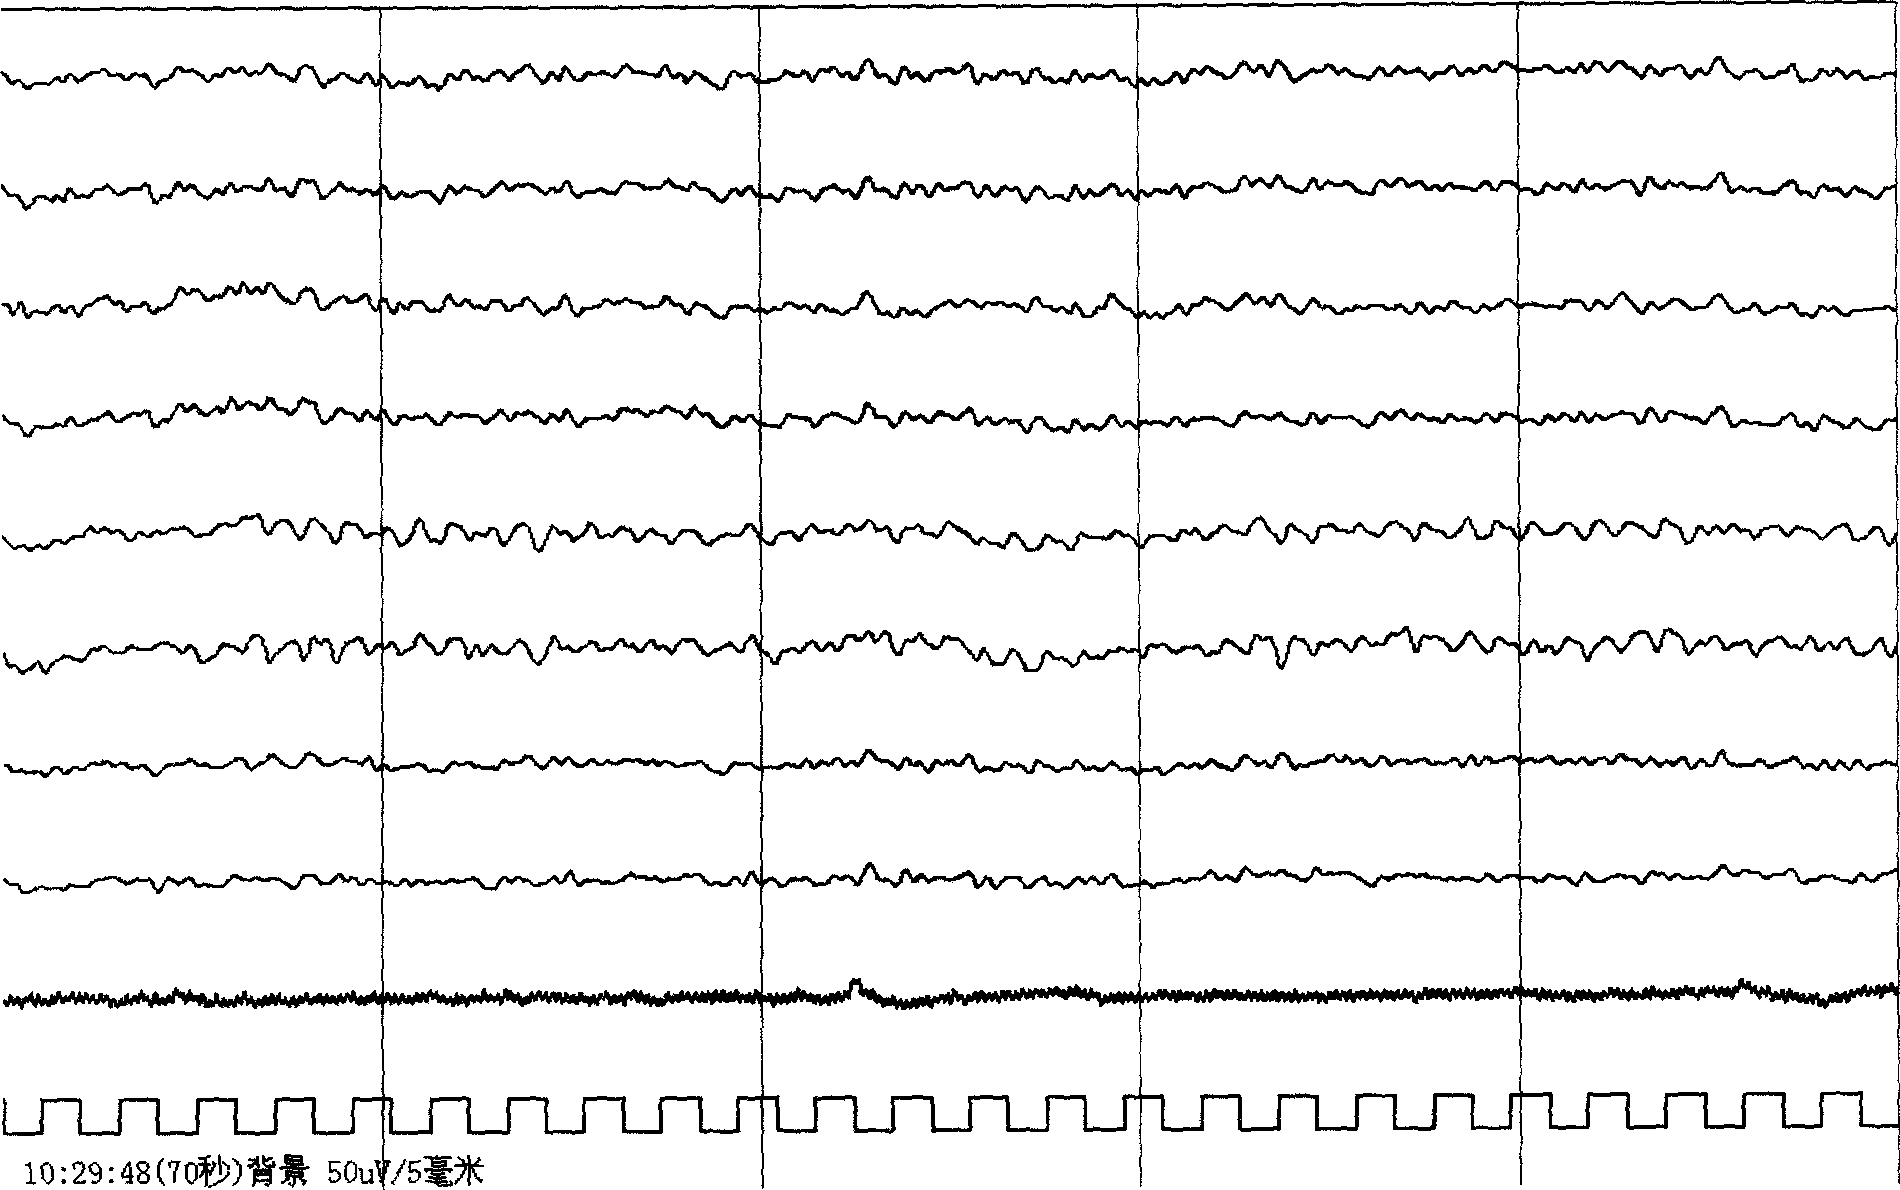
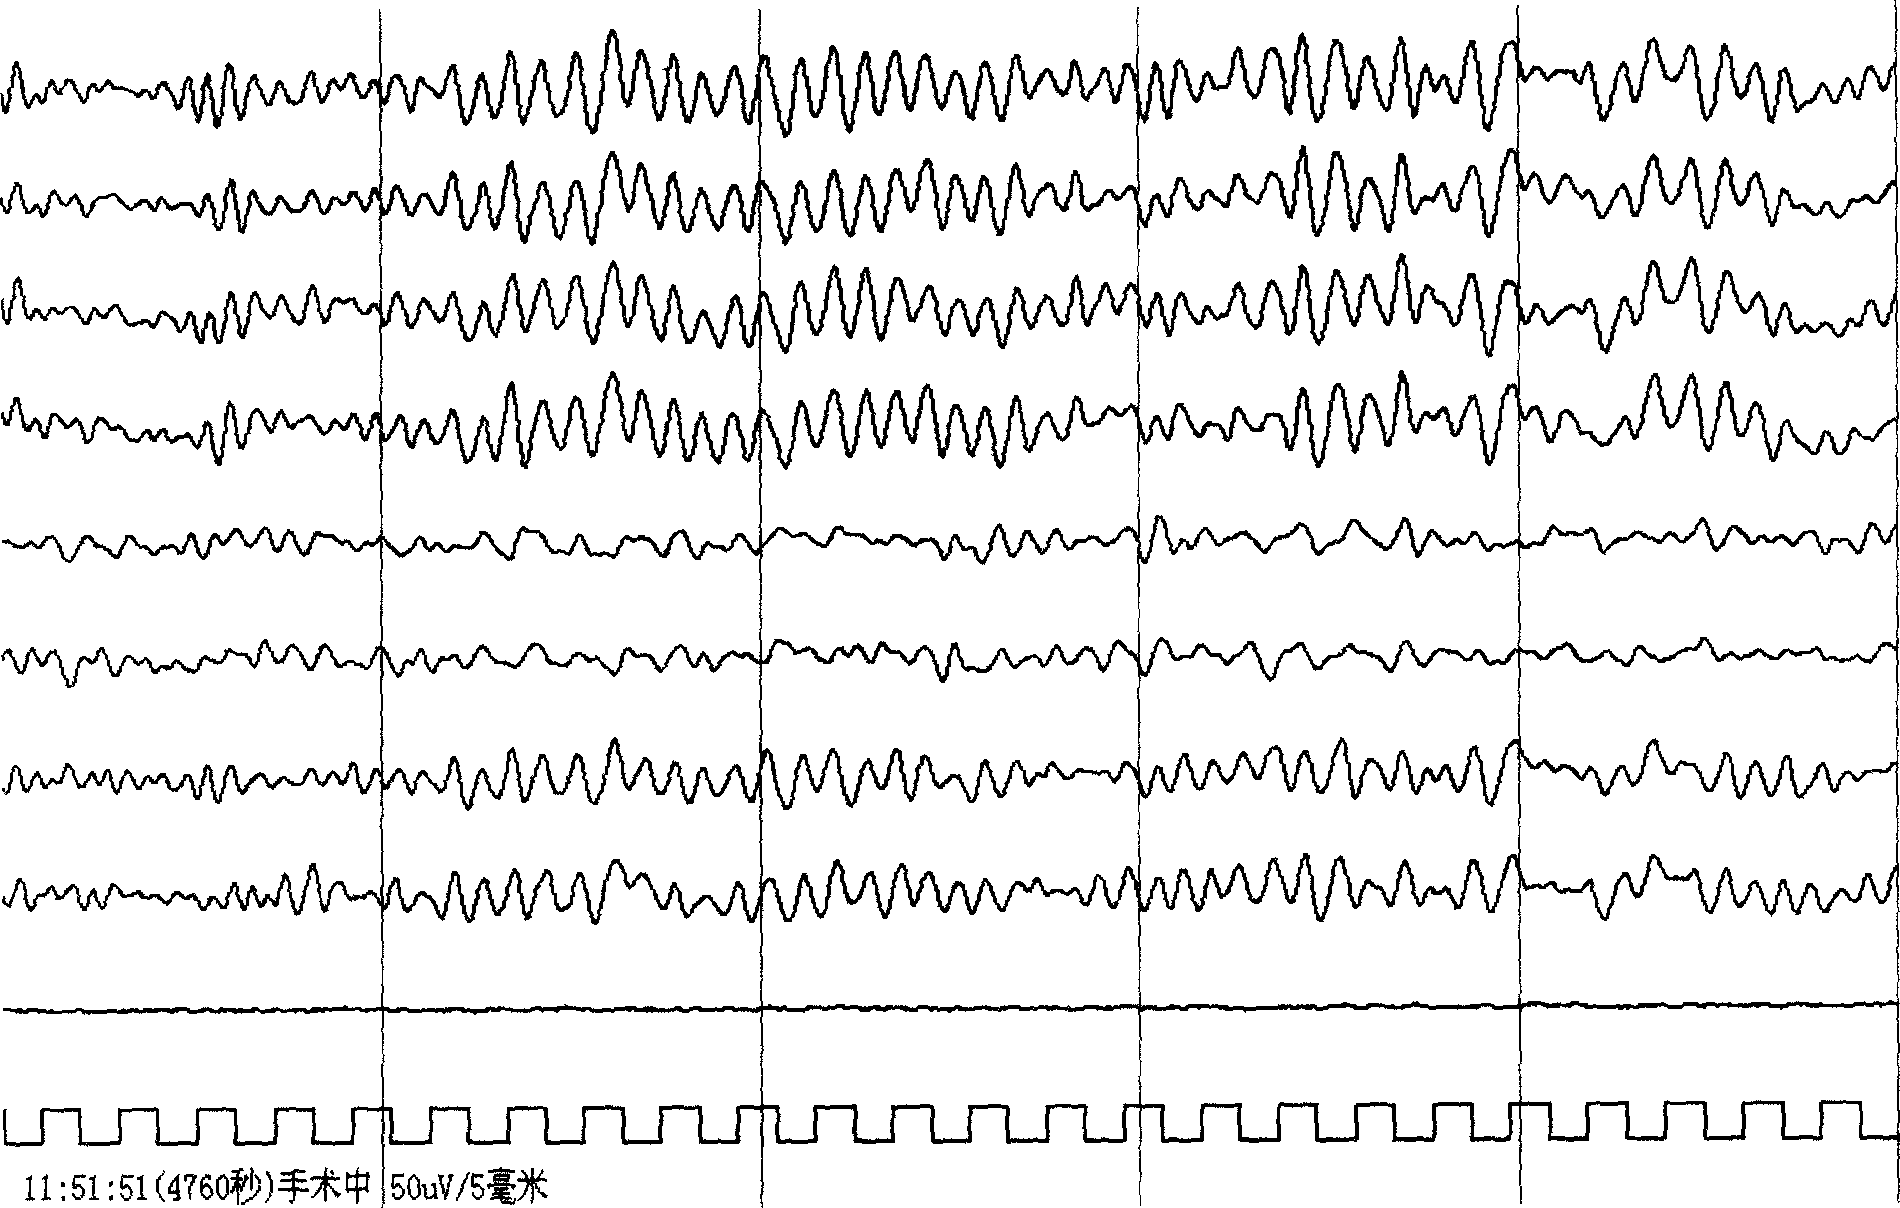
[0034] figure 1 The workflow of the present invention is shown. The present invention uses a multi-lead physiological signal acquisition and analysis system, and places FP on the scalp of patients receiving anesthesia according to the international standard lead 10-20 system. 1 (left forehead), FP 2 (right forehead), T 3 (left temporal), T 4 (right temporal), C 3 (top left), C 4 (top right), O 1 (left pillow), O 2 (Right occipital) 8 conductive electrodes, with the earlobe as a reference. Record the whole process of anesthesia patients from the beginning of anesthesia to the end of anesthesia recovery after surgery. The sampling frequency of raw EEG information is 500 or 1000Hz, and the precision of analog / digital conversion is 12 bits. The collected original EEG signal is A / D converted into digital information, and all kind...


PUM


Abstract

This invention discloses a kind of generating method of real-time monitored brain potential trend chart by adopting computer technique and non-linear dynamics analysis method. It relates to a kind of generating method of brain potential non-linear trend chart. It comprises the following steps: first, collecting original EEG information from different position of scalp; A / D converting to digital EEG information; according to the non-linear dynamics theory and by adopting the trail of state space in time sequence reconstruction system, within one second, converting the conductive digital EEG information to non-linear index that relating to dimension, complexity and approximate entropy, which reflected the current non-linear dynamics characteristic; drawing the non-linear trend chart by using the non-linear index of time sequence, to reflect the non-linear dynamics characteristic variation condition of entire course. This invention can real-time monitor the anaesthesia effect, reflect the variation of anaesthesia effect accurately and promptly.

Description

technical field [0001] The invention discloses a method for generating a brain potential nonlinear trend graph for real-time monitoring by using computer technology and a nonlinear dynamic analysis method. It relates to a method for generating nonlinear trend graphs of brain potentials. Background technique [0002] Traditional EEG analysis methods can be summarized into two categories: time-domain analysis and frequency-domain analysis. Time-domain analysis includes amplitude, frequency, time history, transient distribution and area under the curve, etc., mainly reflecting the geometric properties of EEG signals. Frequency domain analysis shows the law of EEG signal data changing with frequency and the information reflected. Its core is the power spectrum estimation of each frequency band based on (fast) Fourier transform, including power spectrum and coherence. Fourier transform requires the signal to be definite and stable, but there are ...

Claims


Application Information

Patent Timeline
Patent Type & Authority Applications(China)
IPC IPC(8): G06F19/00
Inventor 吴东宇
Owner XUANWU HOSPITAL OF CAPITAL UNIV OF MEDICAL SCI
Why Eureka
Try Eureka