Method for selecting compounds from a combinatorial or other chemistry library for efficient synthesis
- Summary
- Abstract
- Description
- Claims
- Application Information
AI Technical Summary
Benefits of technology
Problems solved by technology
Method used
Image
Examples
example a
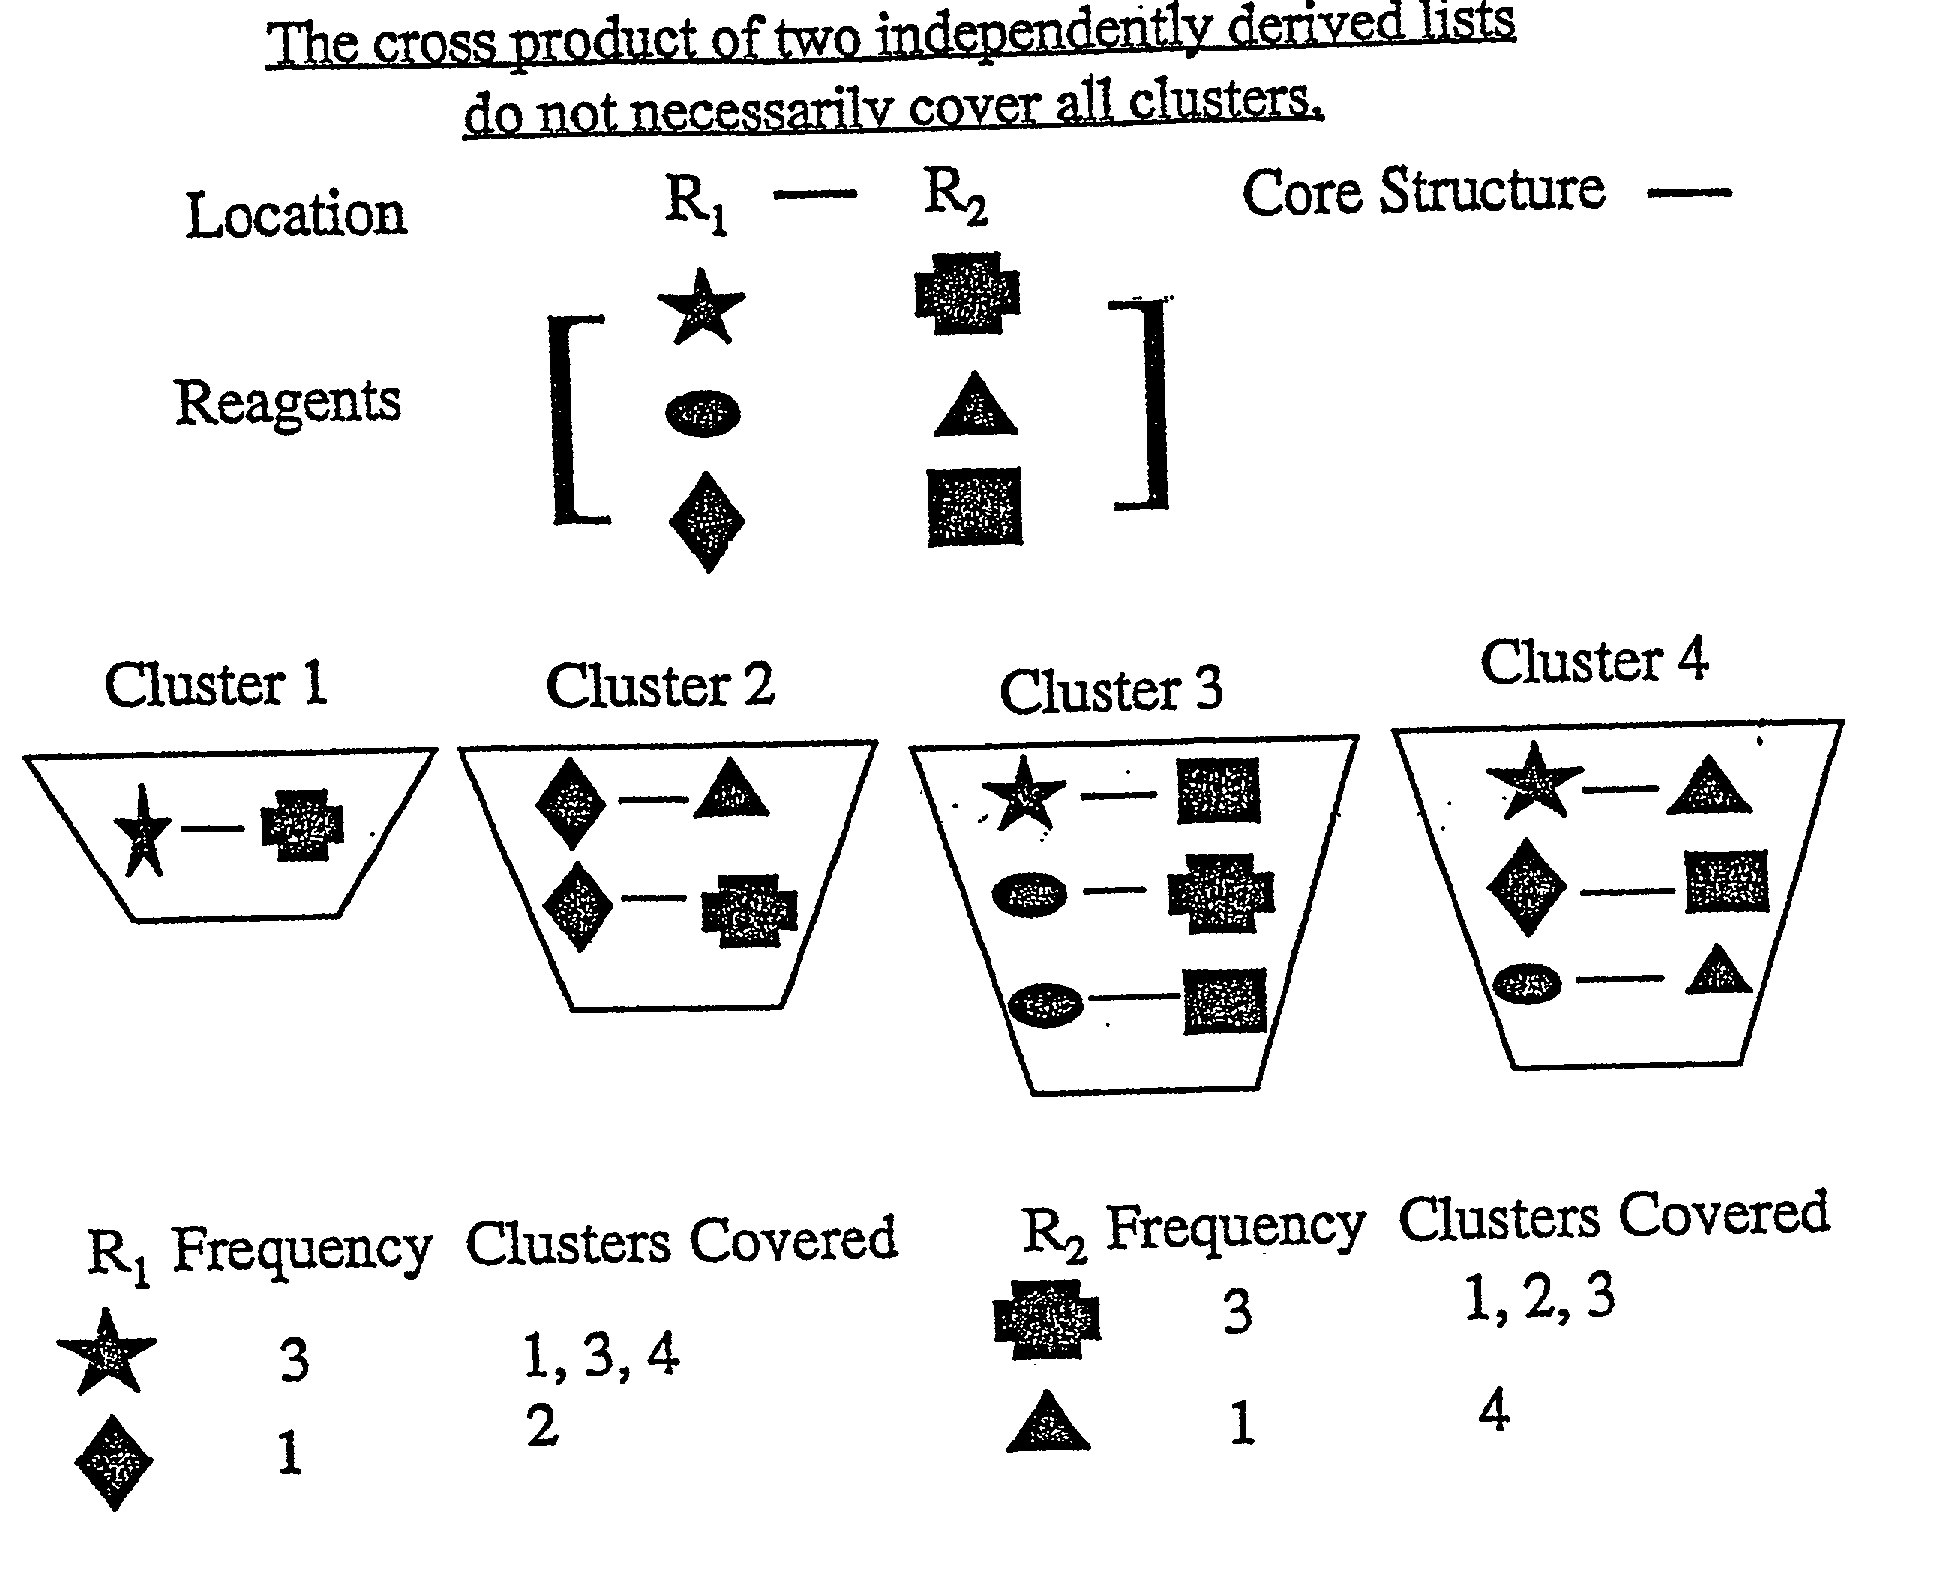
[0040] Let R1 have n1 elements and R2 have n2 elements. Then the "R" group frequency lists created are crossed (e.g. R1.times.R2) to form a library with (n1.times.n2) number of compounds. The number of partitions (clusters, cells, etc.) covered by these compounds are determined based on the original distribution of the entire compound library within the partitions. Because the "R" groups frequency is determined independently of each other, it would be unlikely that all of the clusters would be represented. This is demonstrated schematically by reference to FIG. 1.
[0041] FIG. 1 shows schematically the nine possible combinations of crossing R1 with R2, e.g., star crossed with triangle. The nine combinations are then partitioned into four clusters, shown as Cluster 1, Cluster 2, Cluster 3, and Cluster 4. Based on reagent frequency analysis, note that the star and after the star the diamond are sufficient to cover all of the clusters for the R1 location. That is, three clusters have R1 ...
example b
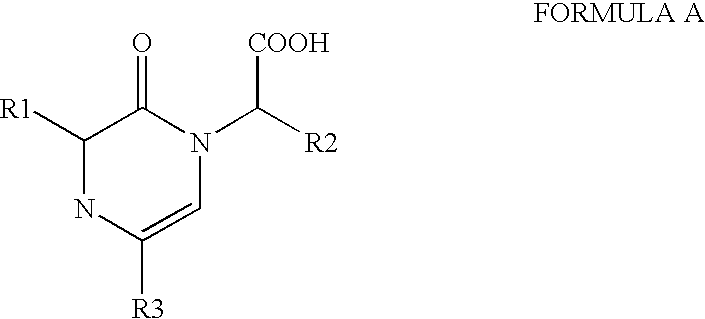
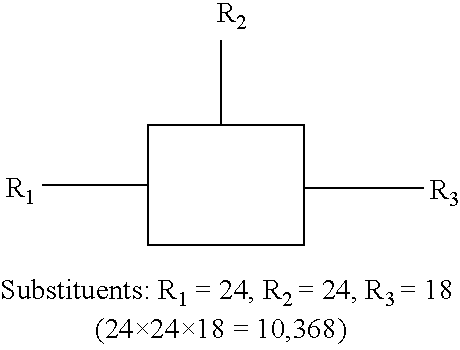
[0071] To demonstrate the advantages of the present invention, the invention was applied to a specific combinatorial library of 10,368 compounds. The Library was generated by substitution at-three locations on a parent structure, as follows: 2
[0072] Activity as measured by percent inhibition was determined for all of the compounds except one. Molconn-Z (Edu Soft, Ashland, Va.) and Cerius.sup.2 (Molecular Simulations Inc, San Diego, Calif.) software were used to generate 249 chemical descriptors for each compound in the library. SAS.RTM. (SAS Institute Inc., Cary, N.C.) was used to perform Principal Component Analysis on these descriptors. Fifteen components were selected which accounted for 90% of the variability. This 15-space was clustered by nonhierarchical non-parametric density estimation by various k values (nearest neighbors) using SAS.RTM. software (MODECLUS procedure). A k value of 6 was selected by the chemists which gave an acceptable resolution of compounds into clusters...
examples plate
Configurations
[0084] Referring to the drawings, Plate 1 is shown in FIG. 10A In well 1 (first row, first column) a compound was selected from cluster 504. There were 8 compounds in that cluster of which 3 were active. The compound selected from that cluster was not active. This cluster did not have any other duplicate representatives and the 3 active compounds might not have been discovered due to this situation. In well 54 (row 7, column 6) a compound from cluster 132 was selected. There were 14 compounds in that cluster and 3 were active. One of those actives was discovered.
[0085] Sometimes patterns can be found within the plate configuration. In column 3 for example there seems to be higher activity associated with the HIS group at location R.sub.3.
[0086] Referring to the drawings, Plate 2 is shown in FIG. 10B.
[0087] Again there seems to be higher activities corresponding to the R.sub.3 location having a LEU (column 4) or NPHE group (column 7). Note on this plate well 54 (row 7, ...
PUM
| Property | Measurement | Unit |
|---|---|---|
| Fraction | aaaaa | aaaaa |
| Fraction | aaaaa | aaaaa |
| Fraction | aaaaa | aaaaa |
Abstract
Description
Claims
Application Information
 - R&D
- Intellectual Property
- Life Sciences
- Materials
- Tech Scout
- Unparalleled Data Quality
- Higher Quality Content
- 60% Fewer Hallucinations
Browse by: Latest US Patents, China's latest patents, Technical Efficacy Thesaurus, Application Domain, Technology Topic, Popular Technical Reports.
© 2025 PatSnap. All rights reserved.Legal|Privacy policy|Modern Slavery Act Transparency Statement|Sitemap|About US| Contact US: help@patsnap.com


