
Method and system for curve quality control

Active Publication Date: 2004-01-01
CYTIVA SWEDEN AB
View PDF10 Cites 48 Cited by
  • Summary
  • Abstract
  • Description
  • Claims
  • Application Information

AI Technical Summary

Problems solved by technology

While it is possible for the operator of the biosensor instrument to assess the quality of the produced sensorgrams manually and discard any sensorgram of unacceptable quality, the current trend towards systems with ever increasing throughput and information density in the analyses performed puts a more and more heavy burden on the operator.
Such quality classification may particularly be used to identify curves which differ from that of the majority of the curves studied and therefore are potentially of bad quality.
The top-right curve, on the other hand, is too unstable, and the bottom-right curve is deformed due to air-peaks (air bubbles in the fluid flow).
The quality of a sensorgram being odd does, however, not necessarily mean that the quality is bad, and the "odd" sensorgrams are therefore subjected to a validation procedure where it is decided if the sensorgram is to be accepted or discarded.
In contrast to the other methods mentioned above, this method does not provide any ranking.

Method used


Image

  • Method and system for curve quality control
  • Method and system for curve quality control
  • Method and system for curve quality control

Examples


Embodiment Construction

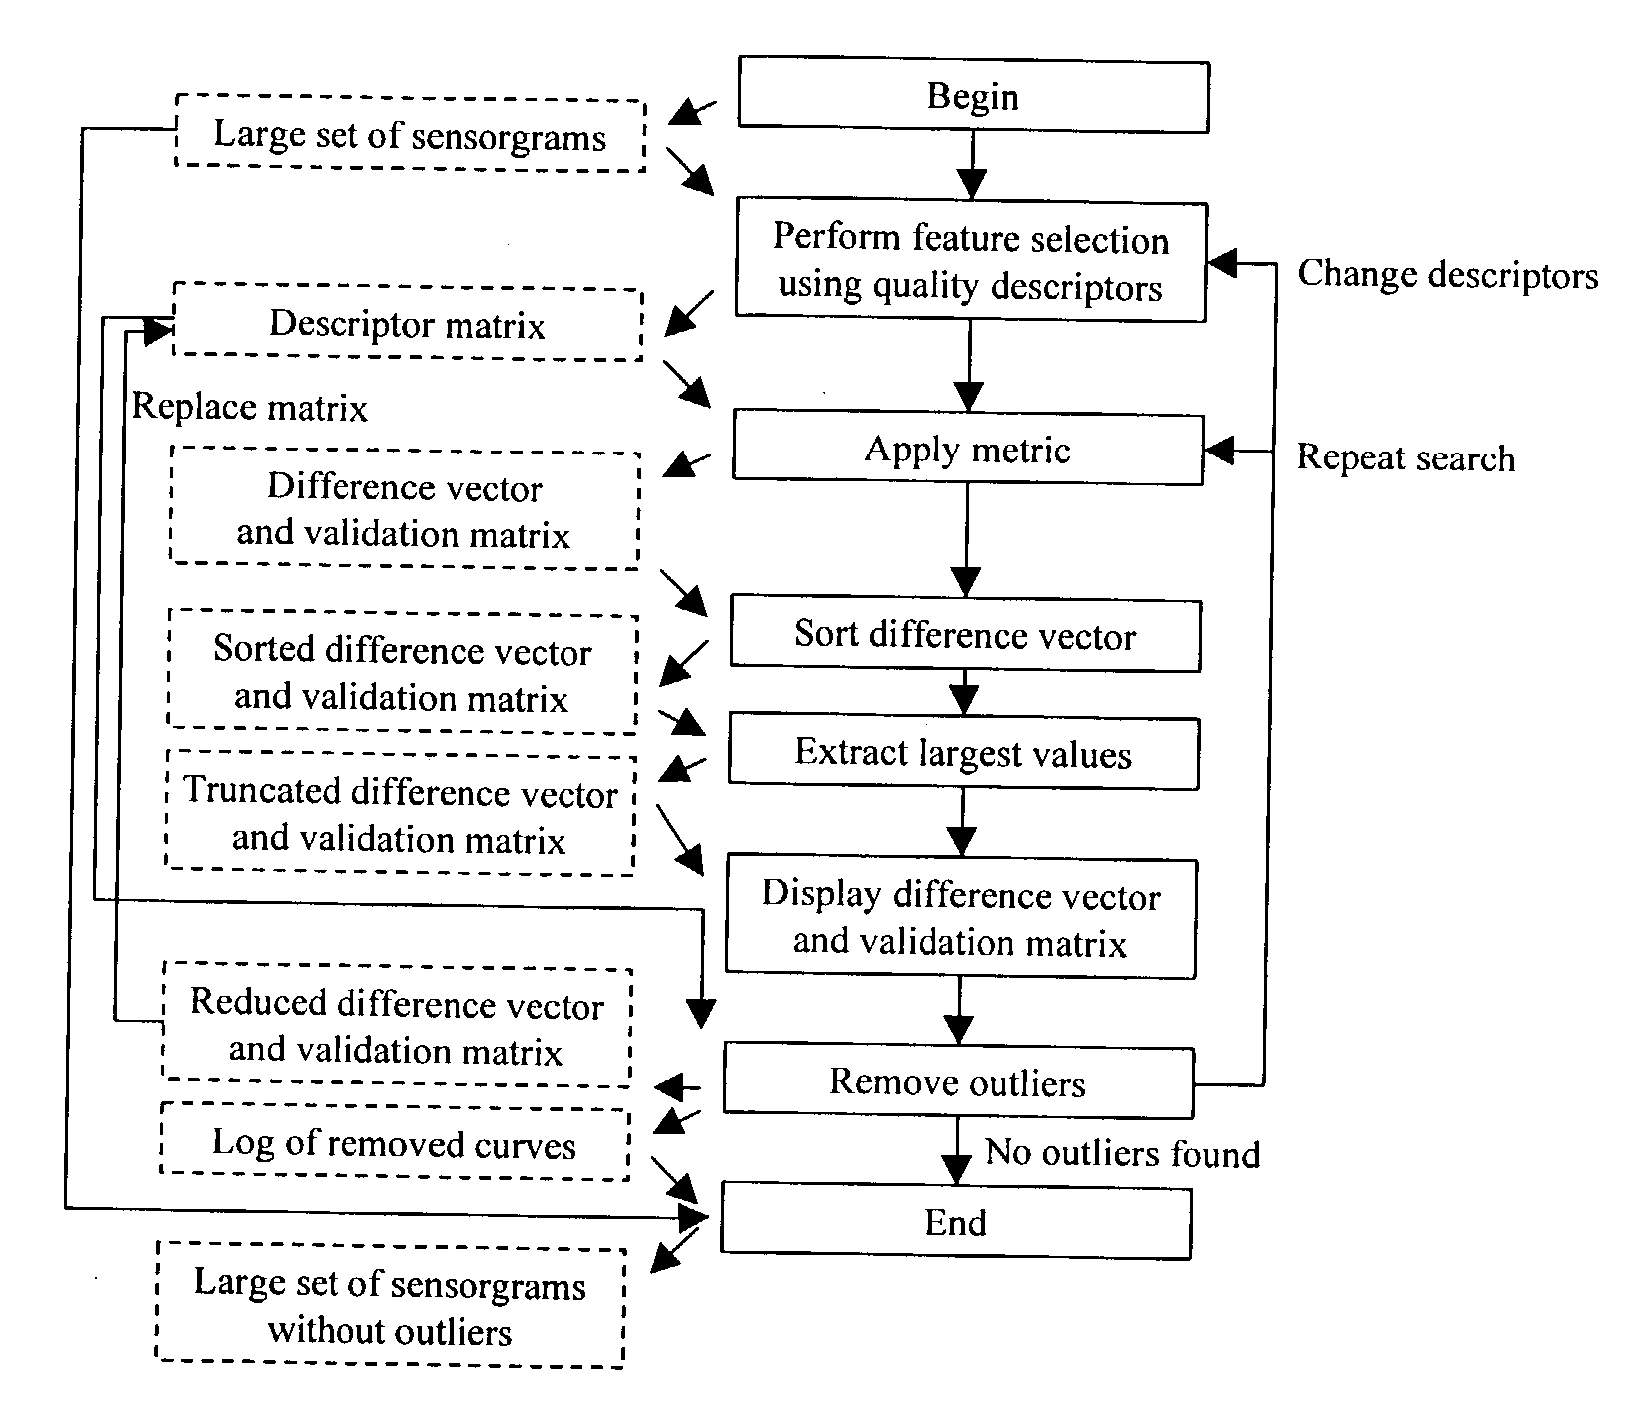
[0062] Eleven sensorgrams (below referred to as RU 1 to 11) were extracted from test data obtained with a BIACORE.RTM. 3000 (Biacore AB, Uppsala, Sweden). These sensorgrams were used to successfully run a simple embodiment of the algorithm outlined in FIG. 3 in MATLAB 5.3.1.29215a (R11.1) (The MathWorks, Inc., Natick, Mass., U.S.A.), using a PC with Windows NT 4.0. As descriptors were used (i) negative dissociation ("negd2"), (ii) jumpy association region ("assjmpmedian"), and (iii) jumpy dissociation region ("dissjmpmedian"). The metric used was the norm of the difference between the descriptors and the mean of the descriptor matrix. The program and the sensorgrams (values) are shown below.

2 %program begin function example %load sensorgrams [t,RU]=getRU; %get descriptor values: negd2=desc_negd2(t,RU,200); %define d2 at time 200s assjmpmedian=desc_jmpmedian(t,RU,10,100); %define association region to 10-100 s dissjmpmedian=desc_jmpmedian(t,RU,130,180); %define dissociation region to...


PUM


Abstract

A method of analysis wherein molecular interactions at one or more sensing surface areas are detected and respective response curves representing the progress of each interaction with time are produced, and wherein a resulting set of response curves is subjected to a quality assessment procedure which comprises representing the response curves with one or more quality descriptors, applying a quality classification method to the descriptors to find outliers, and removing the outliers. The invention also relates to an analytical system including means for classifying the response curves with regard to quality, a computer program for performing the classification, and a computer program product containing the program.

Description

[0001] This application claims the benefit of U.S. Provisional Patent Application No. 60 / 367,806 filed Mar. 27, 2002 and Swedish Patent Application No. 0200949-6 filed Mar. 27, 2002, both of which are incorporated herein by reference in their entireties.[0002] 1. Field of the Invention[0003] The present invention relates to a method of analyzing molecular binding interactions at a sensing surface, and more particularly to the quality control of the resulting data describing the molecular interactions. The invention also relates to an analytical system including such a quality control as well as to a computer program for performing the method, and a computer system and computer program product, respectively, containing the program.[0004] 2. Description of the Prior Art[0005] Analytical sensor systems that can monitor interactions between molecules, such as biomolecules, in real time are gaining increasing interest. These systems are often based on optical biosensors and usually refer...

Claims


Application Information

Patent Timeline
IPC IPC(8): G01NG01N33/543G16B20/00G16B40/20
CPCG01N33/54373G06F19/24G06F19/18G16B20/00G16B40/00G16B40/20
Inventor ANDERSSONBORG, PETER
Owner CYTIVA SWEDEN AB
Features
  • Generate Ideas
  • Intellectual Property
  • Life Sciences
  • Materials
  • Tech Scout
  • Unparalleled Data Quality
  • Higher Quality Content
  • 60% Fewer Hallucinations
Learn More