
Significance testing and confidence interval construction based on user-specified distributions

a confidence interval and significance testing technology, applied in the field of statistical data analysis, can solve the problems that the practice of non-linear transformation actually introduces unintended and significant errors into the analysis

Inactive Publication Date: 2004-09-02
PEACE TERRENCE B
View PDF29 Cites 18 Cited by
  • Summary
  • Abstract
  • Description
  • Claims
  • Application Information

AI Technical Summary

Benefits of technology

[0011] It is yet another object of the invention to provide a method and apparatus to analyze said data without transforming the naturally occurring distribution of the original data into a Normal distribution, a Poisson distribution, or the like, thereby avoiding errors which transformation may introduce into the analysis, said transformation preceding traditional data analysis techniques.
[0014] It is an additional object of the present invention to provide a method and apparatus of statistical analysis which enable the user to construct new test statistics, rather than rely on those test statistics with distributions that have already been determined. The subject invention removes this restriction so that any function of the data may be used as a test statistic.
[0015] It is a further object of the present invention to provide a method and apparatus for statistical analysis that enables the user to make inferences on multiple parameters simultaneously. The instant invention will permit all aspects of more than one distribution to be tested one against the other in a single analysis and determine significant differences, if any exist.
[0016] Yet another object of the present invention is to provide a method and apparatus that enables a user to perform sensitivity analysis on the inference procedure while using all of the underlying data.
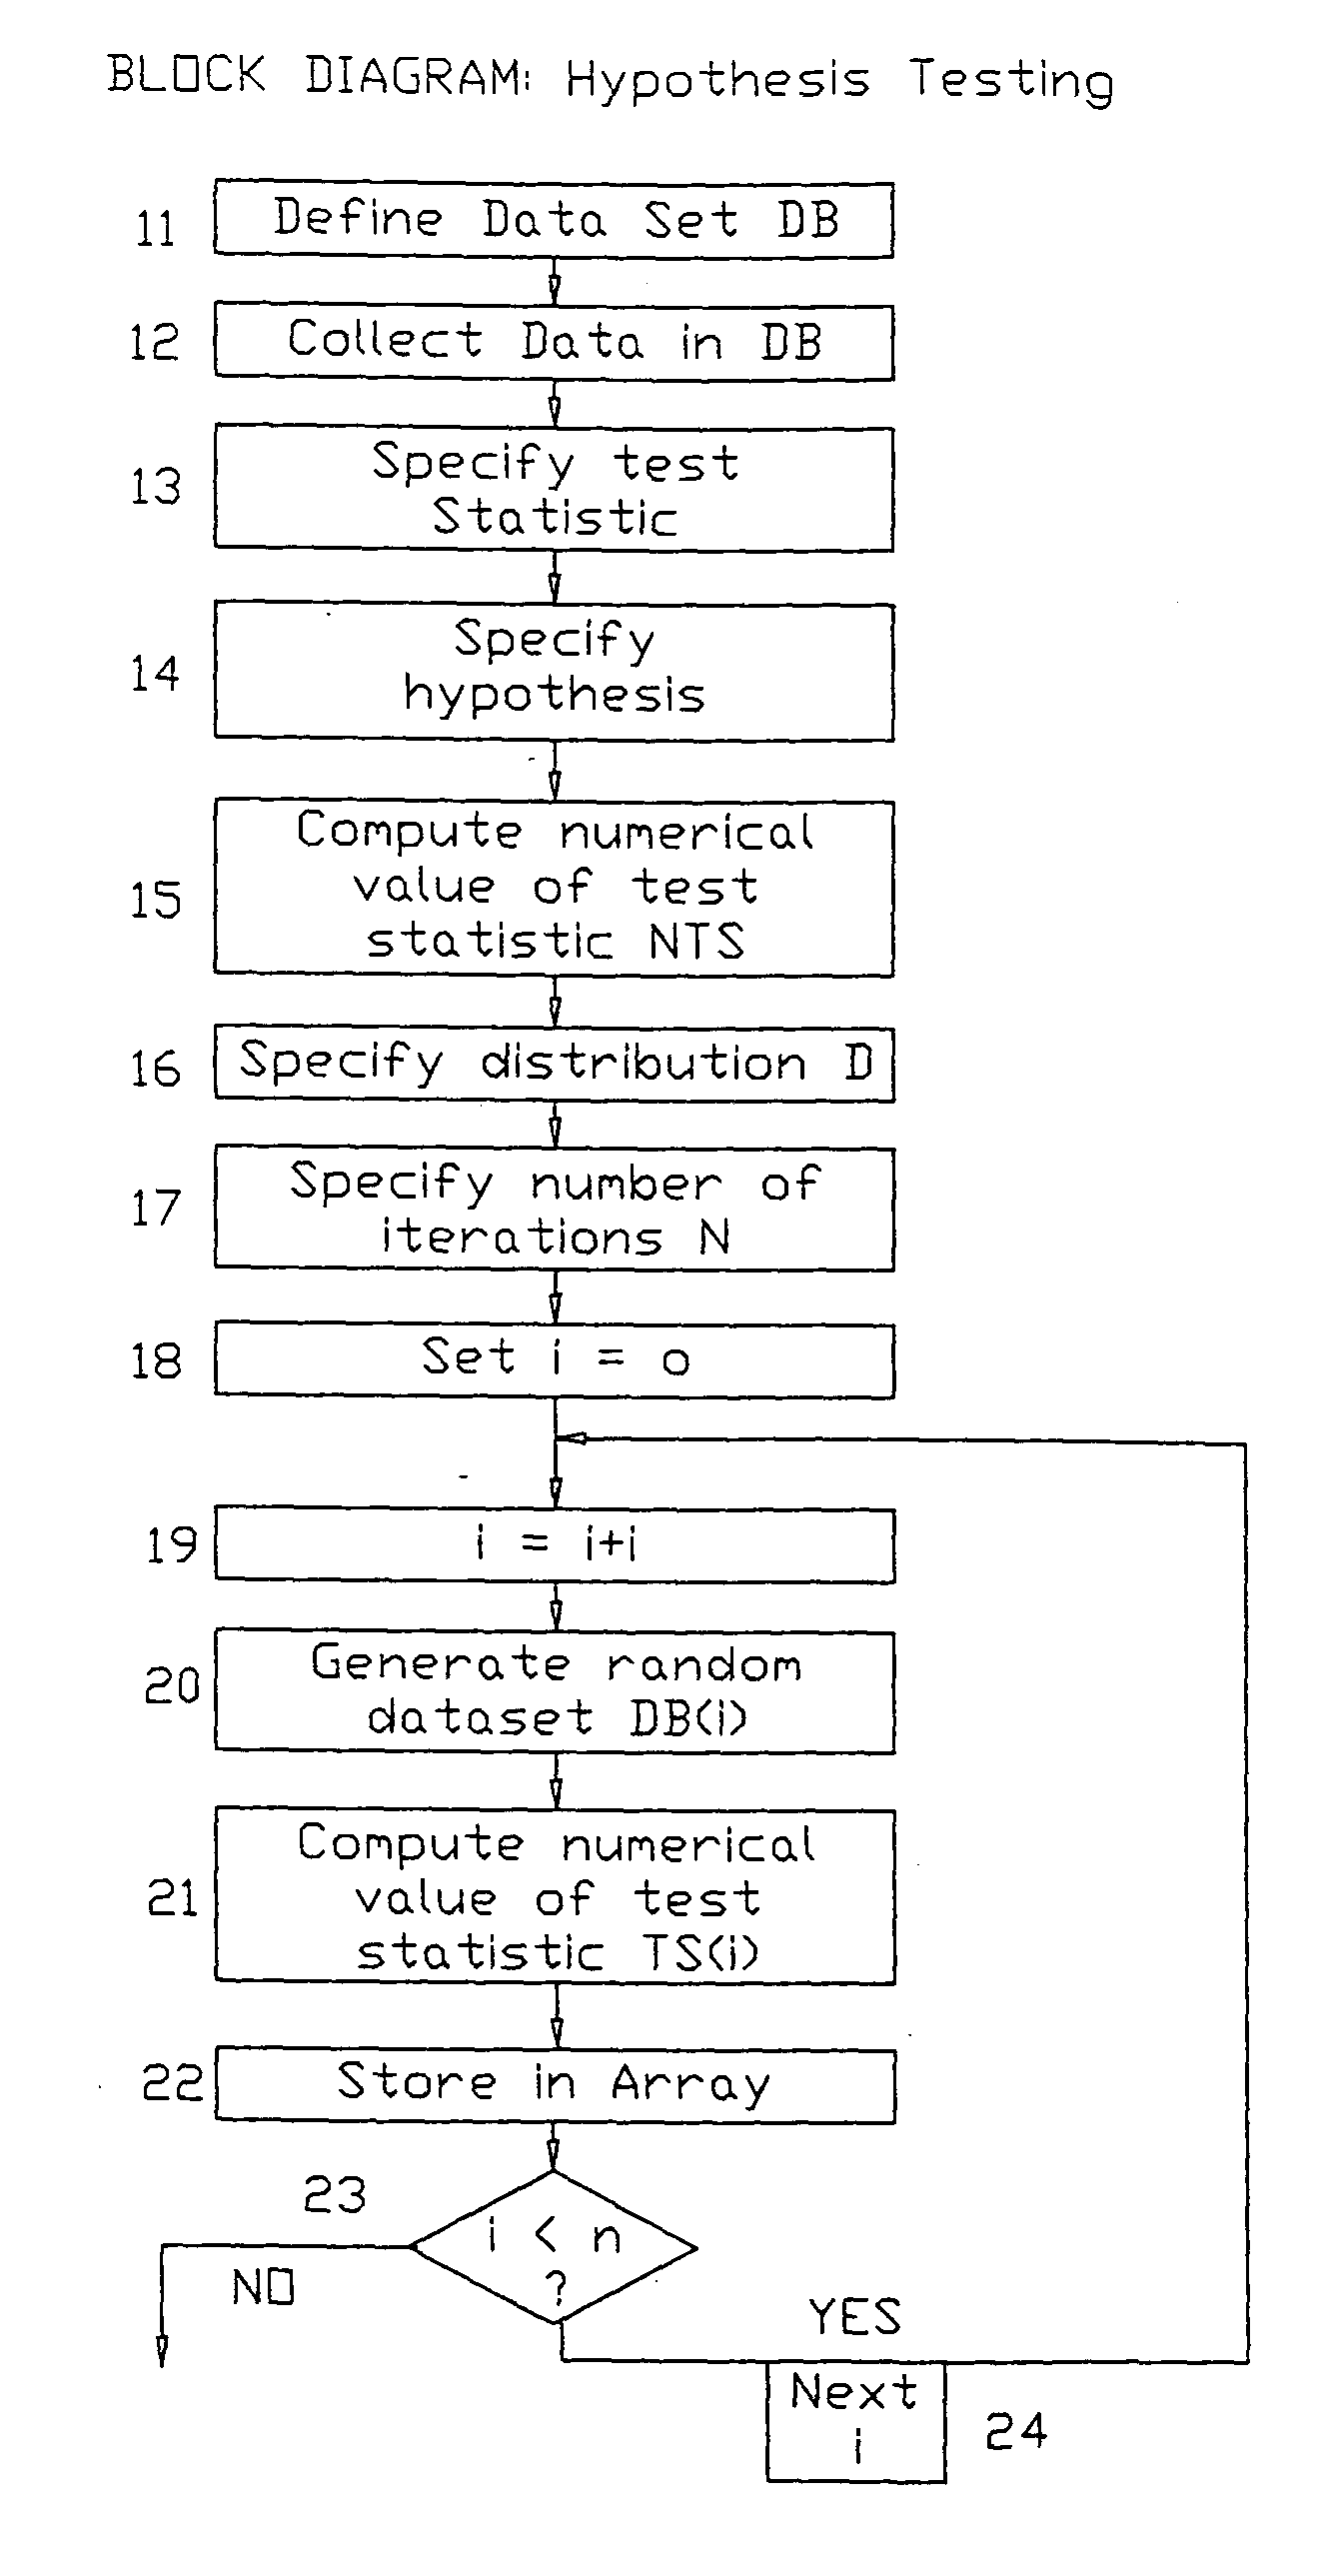
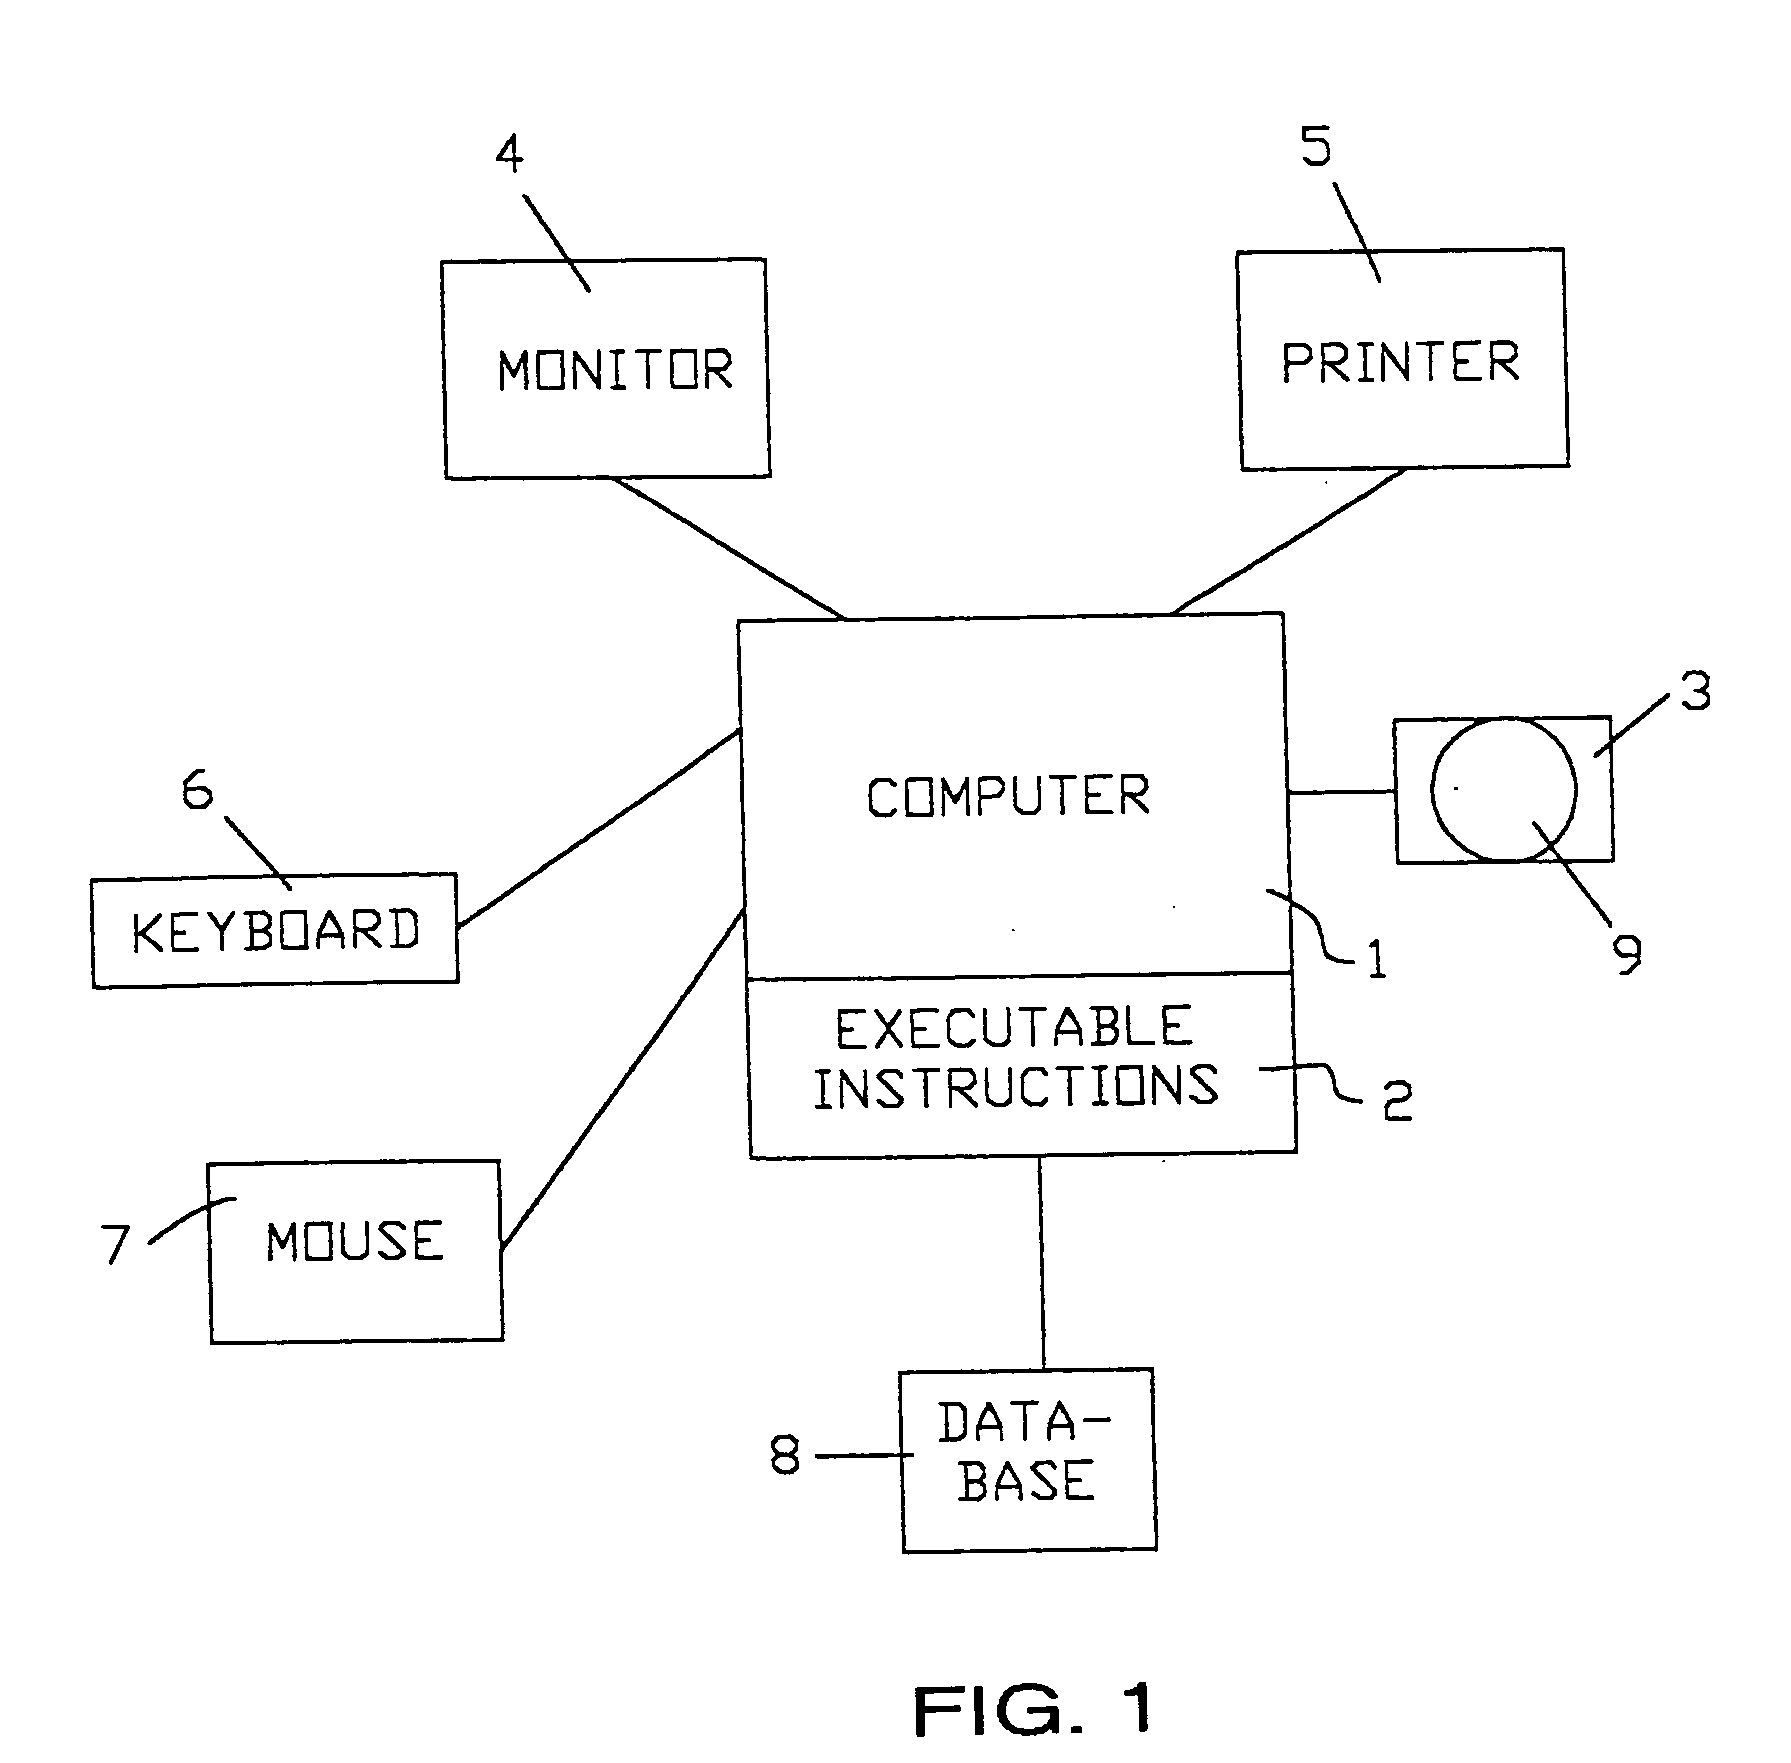
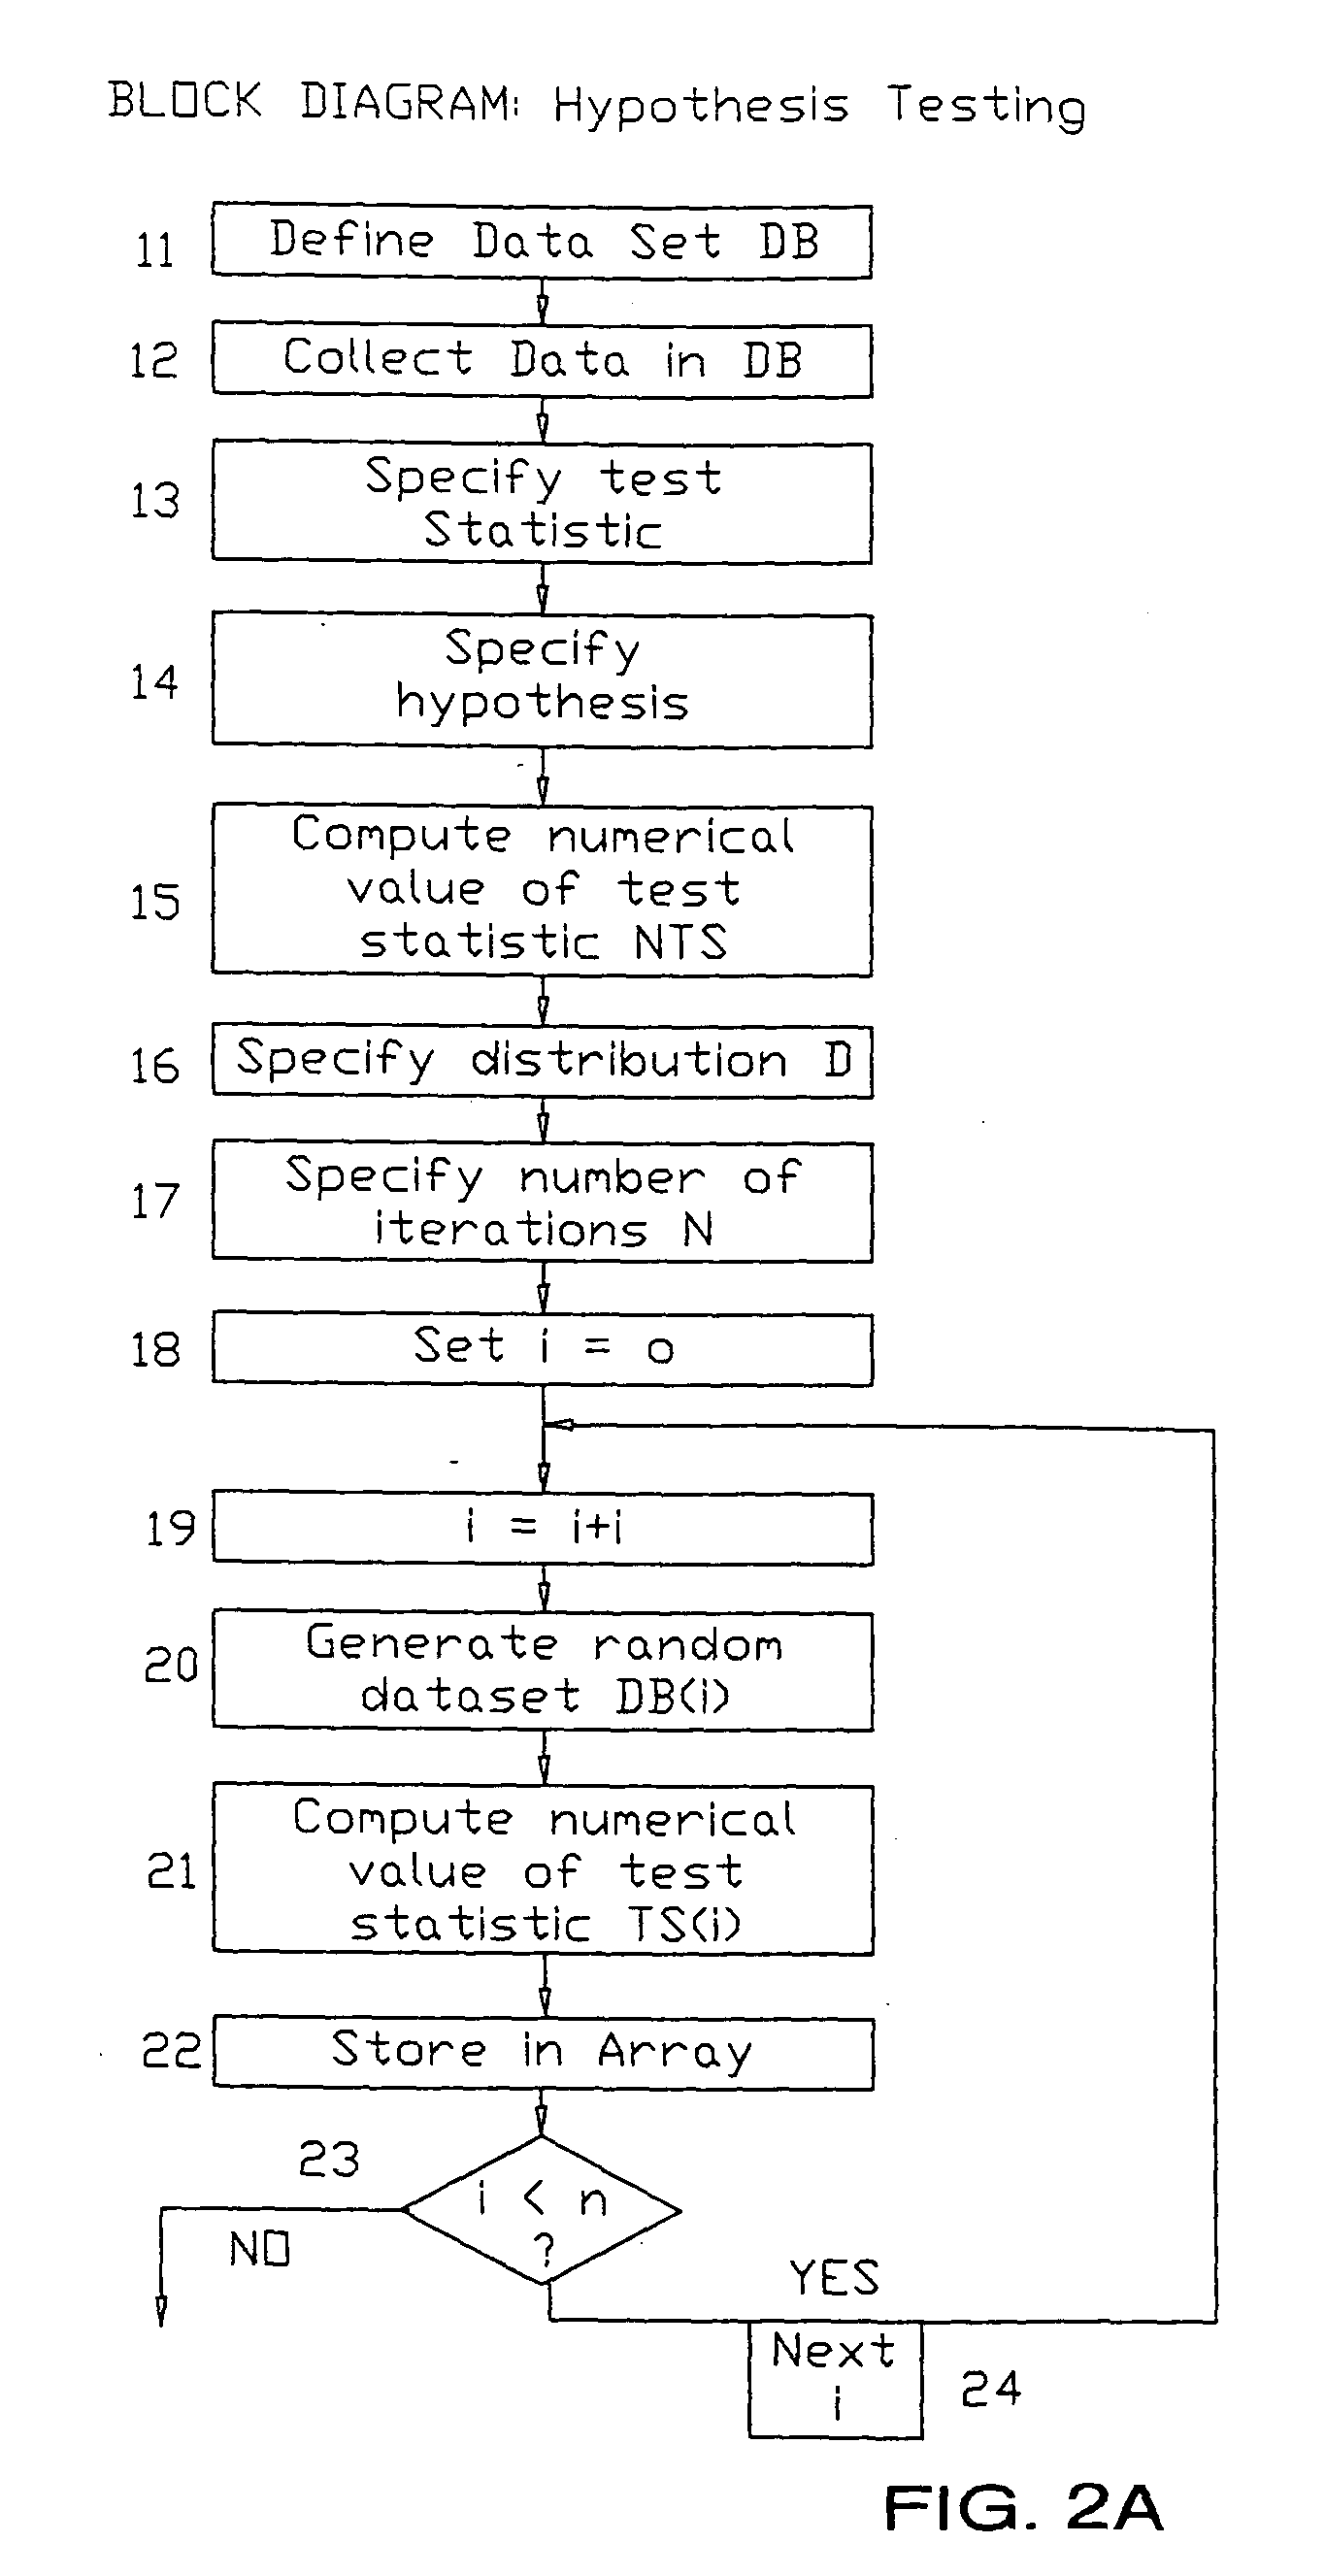
[0018] The invention achieves the above objects by providing a technique to analyze empirical data within its original distribution rather than transforming it to a Normal or Gaussian distribution, for example. It is preferably implemented using a digital processing computer, and therefore a computer, as well as a method and program to be executed by a digital processing computer, is contemplated. The technique comprises, in part, the computer generating numerous random or pseudo-random data sets having substantially the same size and dimension as the original data set, with a distribution defined to best describe the process which generated the original data set. Functions of these randomly generated data sets are compared to a corresponding function of the original data set to determine the likelihood of such a value arising purely by chance. One embodiment of the invention requires input from the user defining a number of options, although alternative embodiments of the invention would involve the computer determining options at predetermined stages in the analysis. The method and program disclosed herein is superior in that it allows data to be analyzed more accurately and efficiently, permits the data to be analyzed in accordance with any distribution (including the distribution which generated the data), avoids the errors which may be introduced by data transformation, permits the use of any function of the data as a test statistic, and facilitates sensitivity analysis.

Problems solved by technology

More recent research has demonstrated, however, that the practice of non-linear transformation actually introduces unintended and significant error into the analysis.

Method used


Image

  • Significance testing and confidence interval construction based on user-specified distributions
  • Significance testing and confidence interval construction based on user-specified distributions
  • Significance testing and confidence interval construction based on user-specified distributions

Examples


Embodiment Construction

[0031] As discussed above, the present invention supplies a computer and appropriate software or programming that more accurately analyzes statistical data when that data is not distributed according to the assumptions of the procedure, such as not "normally distributed." The invention therefore provides a method and apparatus for evaluating statistical data and outputting reliable analytical results without relying on traditional prior art transformation techniques, which introduce error. The practice of the present invention results in several unexpectedly superior benefits over the prior art statistical analyses.

[0032] First, it enables the user to construct new and possibly more revealing test statistics, rather than relying on those test statistics with distributions that have already been determined. For example, the "t-statistic" is often used to test whether two samples have the same mean. The numerical value of the t-statistic is calculated and then related to tables that h...


PUM


Abstract

A computer implemented method and program for analyzing statistical an original data set having a first size, dimension and distribution. Multiple random data sets are generated, each having a second size, dimension and distribution related to the first size, dimension and distribution of the original data set. Numerical values of test statistics corresponding to the random data sets are calculated in accordance with a predetermined test statistic formula. A relationship between the numerical values corresponding to the random data sets and the numerical value of the test statistic corresponding to the random data set, calculated in accordance with the test statistic formula, is determined. It is determined that the original data set includes at least one factor not based on chance when the relationship indicates that the numerical value of the original test statistic is not within a range of the numerical values corresponding to the random data sets.

Description

[0001] This application is a continuation-in-part of U.S. patent application Ser. No. 09 / 594,144, filed Jun. 15, 2000, the contents of which is expressly incorporated by reference herein in its entirety.[0002] 1. Field of the Invention[0003] The present invention relates to the analysis of statistical data, preferably on a computer and using a computer implemented program. The invention more specifically relates to a method and apparatus that accurately analyzes statistical data when that data is not normally distributed, by which is meant distributed according to a normal or Guassian distribution, nor distributed according to some other typically used probability distribution, such as Poisson distribution, whether these distributions are univariate or multivariate, or whether these terms refer to marginal distributions.[0004] 2. Description of the Prior Art[0005] Conventional data analysis involves the testing of statistical hypotheses for validation. The usual method for testing t...

Claims


Application Information

Patent Timeline
Patent Type & Authority Applications(United States)
IPC IPC(8): G06F17/18
CPCG06F17/18
Inventor PEACE, TERRENCE B.
Owner PEACE TERRENCE B
Learn More