Characterizing biological stimuli by response curves

a response curve and biological cell technology, applied in the field of biological cell response characterization techniques, can solve the problems of rare and often difficult identification of purified substances having desirable bioactive properties, the vast majority of “hits” generated by such techniques do not possess the right combination of properties to qualify as therapeutic compounds, and are typically found to fail in some regard

Inactive Publication Date: 2005-06-23
CYTOKINETICS INC
View PDF51 Cites 32 Cited by
  • Summary
  • Abstract
  • Description
  • Claims
  • Application Information

AI Technical Summary

Problems solved by technology

Purified substances having a desirable combination of bioactive properties are rare and often difficult to identify.
Unfortunately, the vast majority of “hits” generated by such techniques do not possess the right combination of properties to qualify as therapeutic compounds.
When these substances are subjected to low throughput cellular and animal tests to establish their therapeutic usefulness, they are typically found to fail in some regard.
Unfortunately, such tests are time consuming and costly, thus limiting the number of substances that can be tested.
One difficulty in assessing similarity is that compounds often have greatly varying potencies.
It is difficult to make meaningful comparison of two such compounds until the dose scales of these compounds have been adjusted.
Unfortunately, the value of such comparisons is quite limited.
First, many different features may be required to unambiguously characterize a stimulus' mechanism of action.
So a simple dose response curve may be inconclusive.
Second, even assuming that all the relevant features are captured in the analysis, determining whether the response of an unclassified stimulus more properly belongs to one mechanism or another can be difficult.
While many techniques for characterizing compounds and other biological stimuli exist, their full potential for classifying such stimuli by mechanism of action has not yet been realized.

Method used


Image

  • Characterizing biological stimuli by response curves
  • Characterizing biological stimuli by response curves
  • Characterizing biological stimuli by response curves

Examples


Embodiment Construction

[0038] Introduction

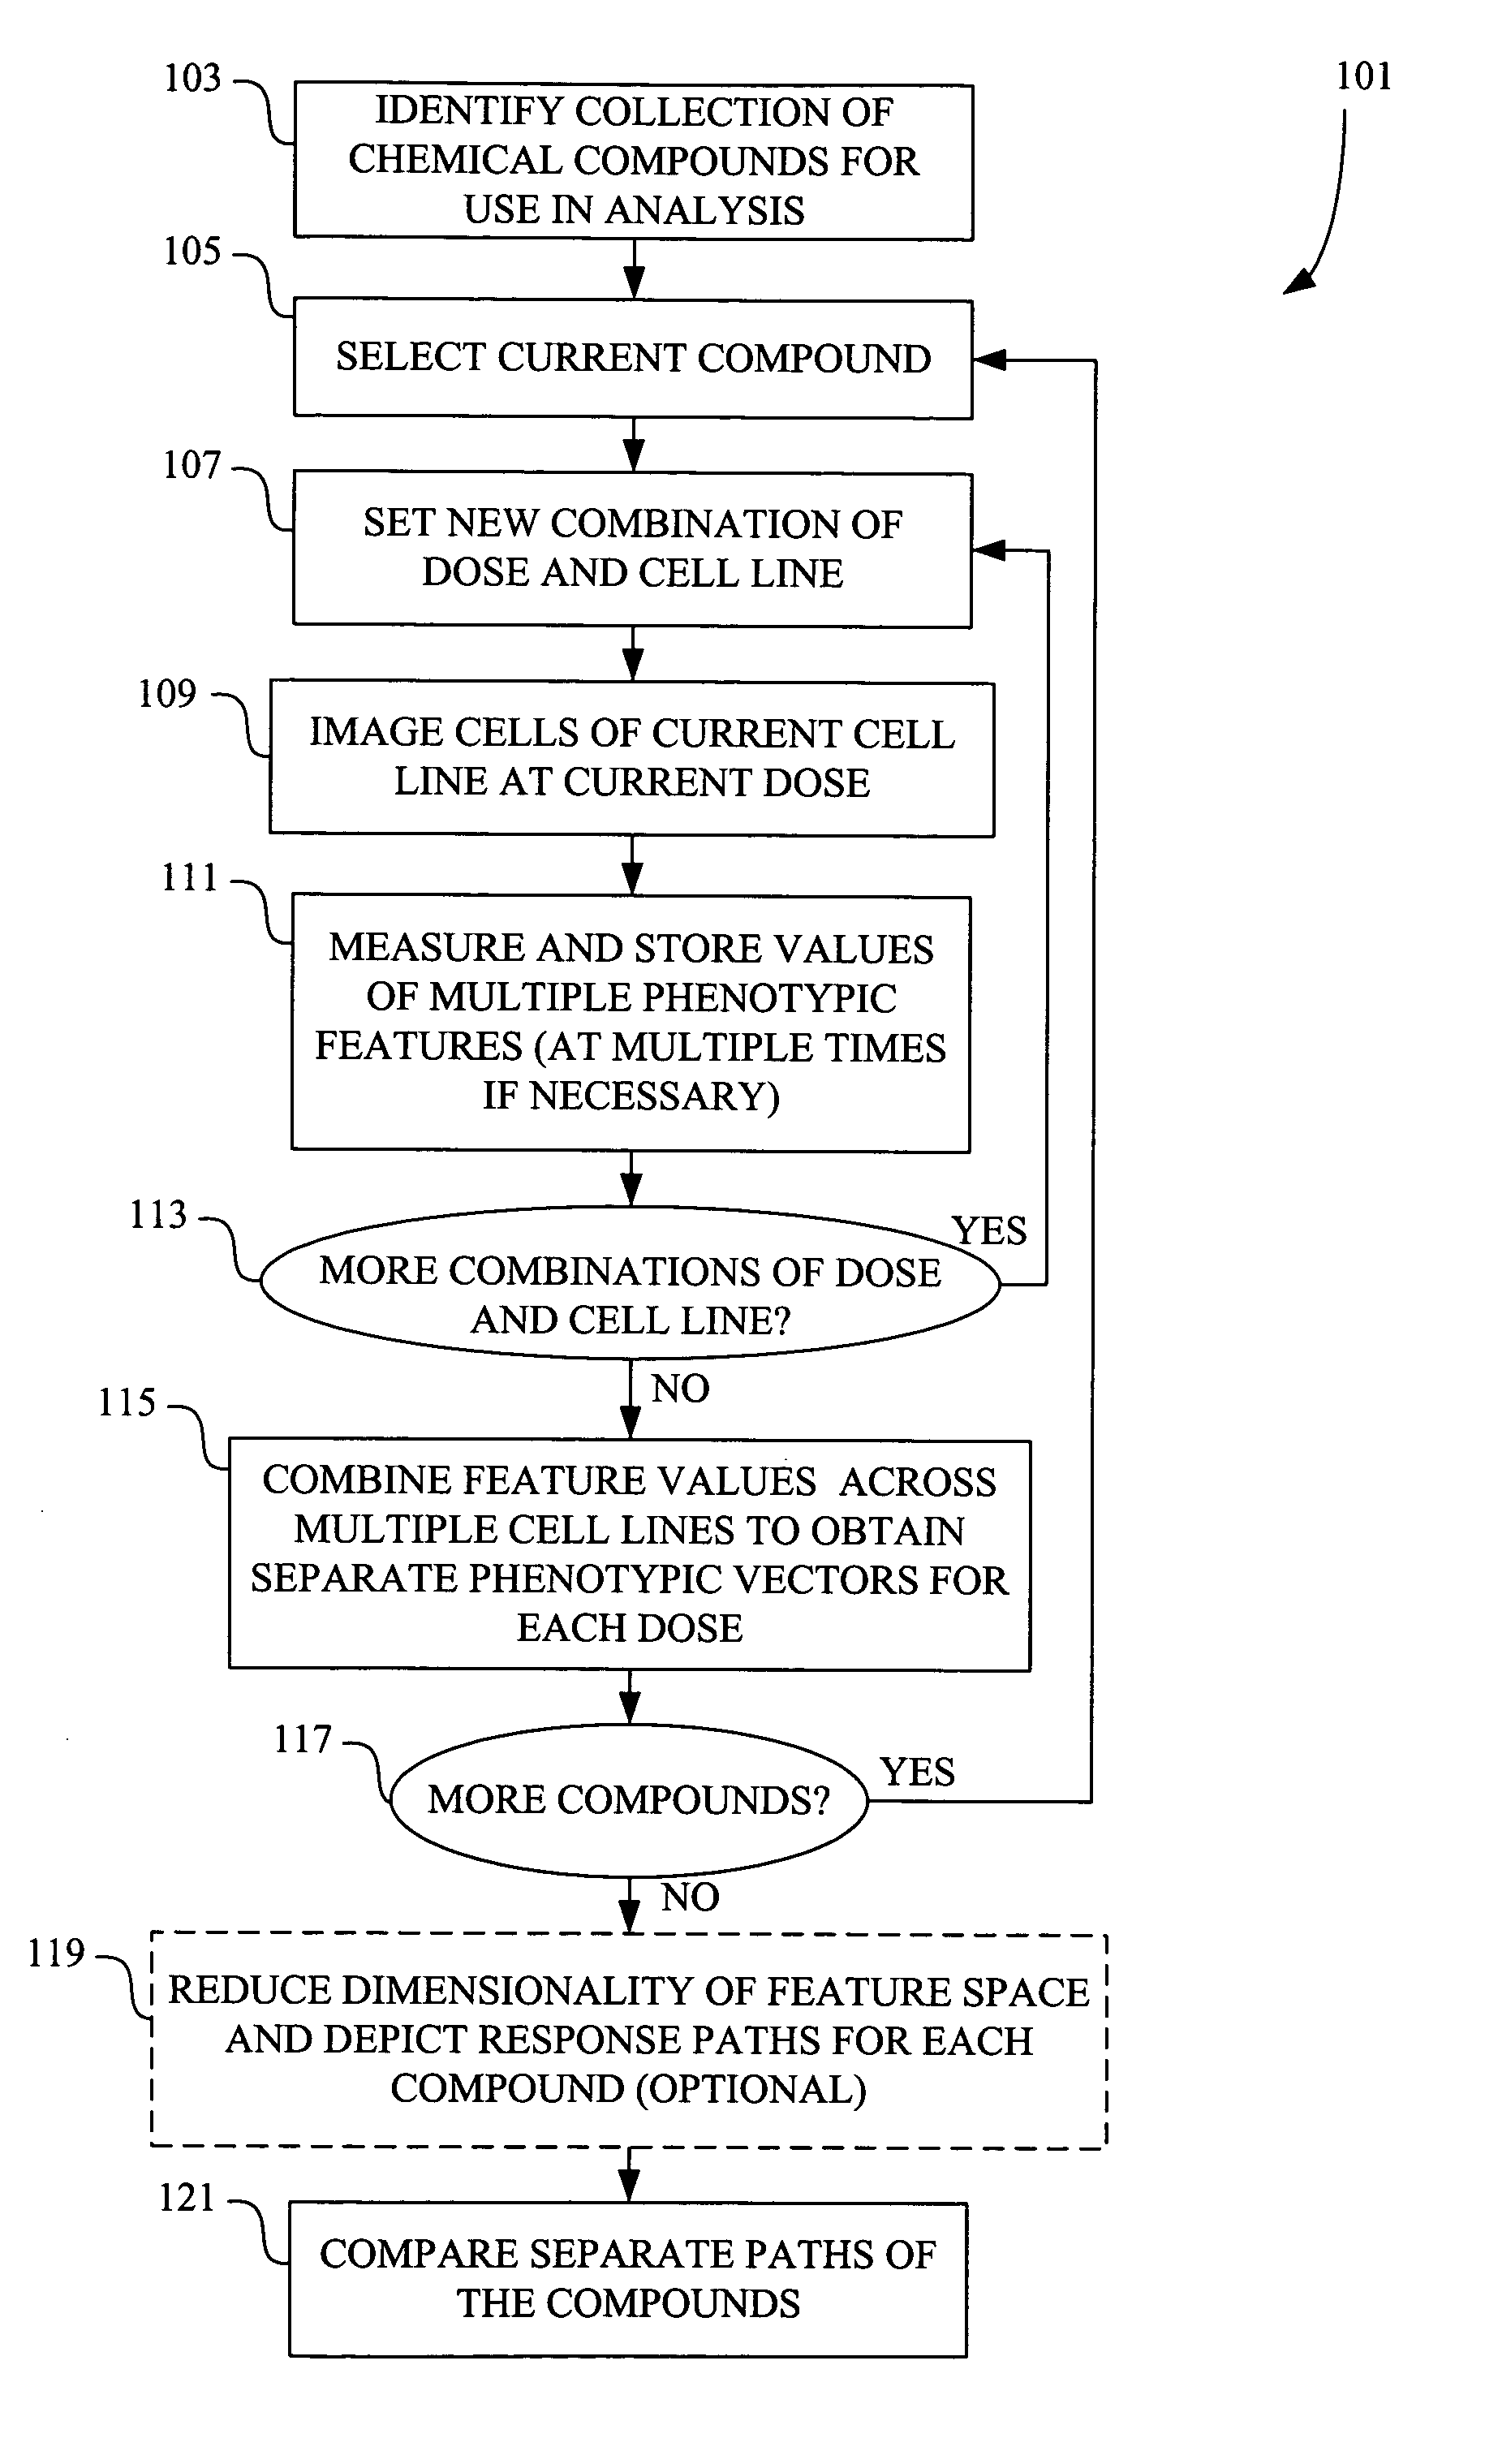
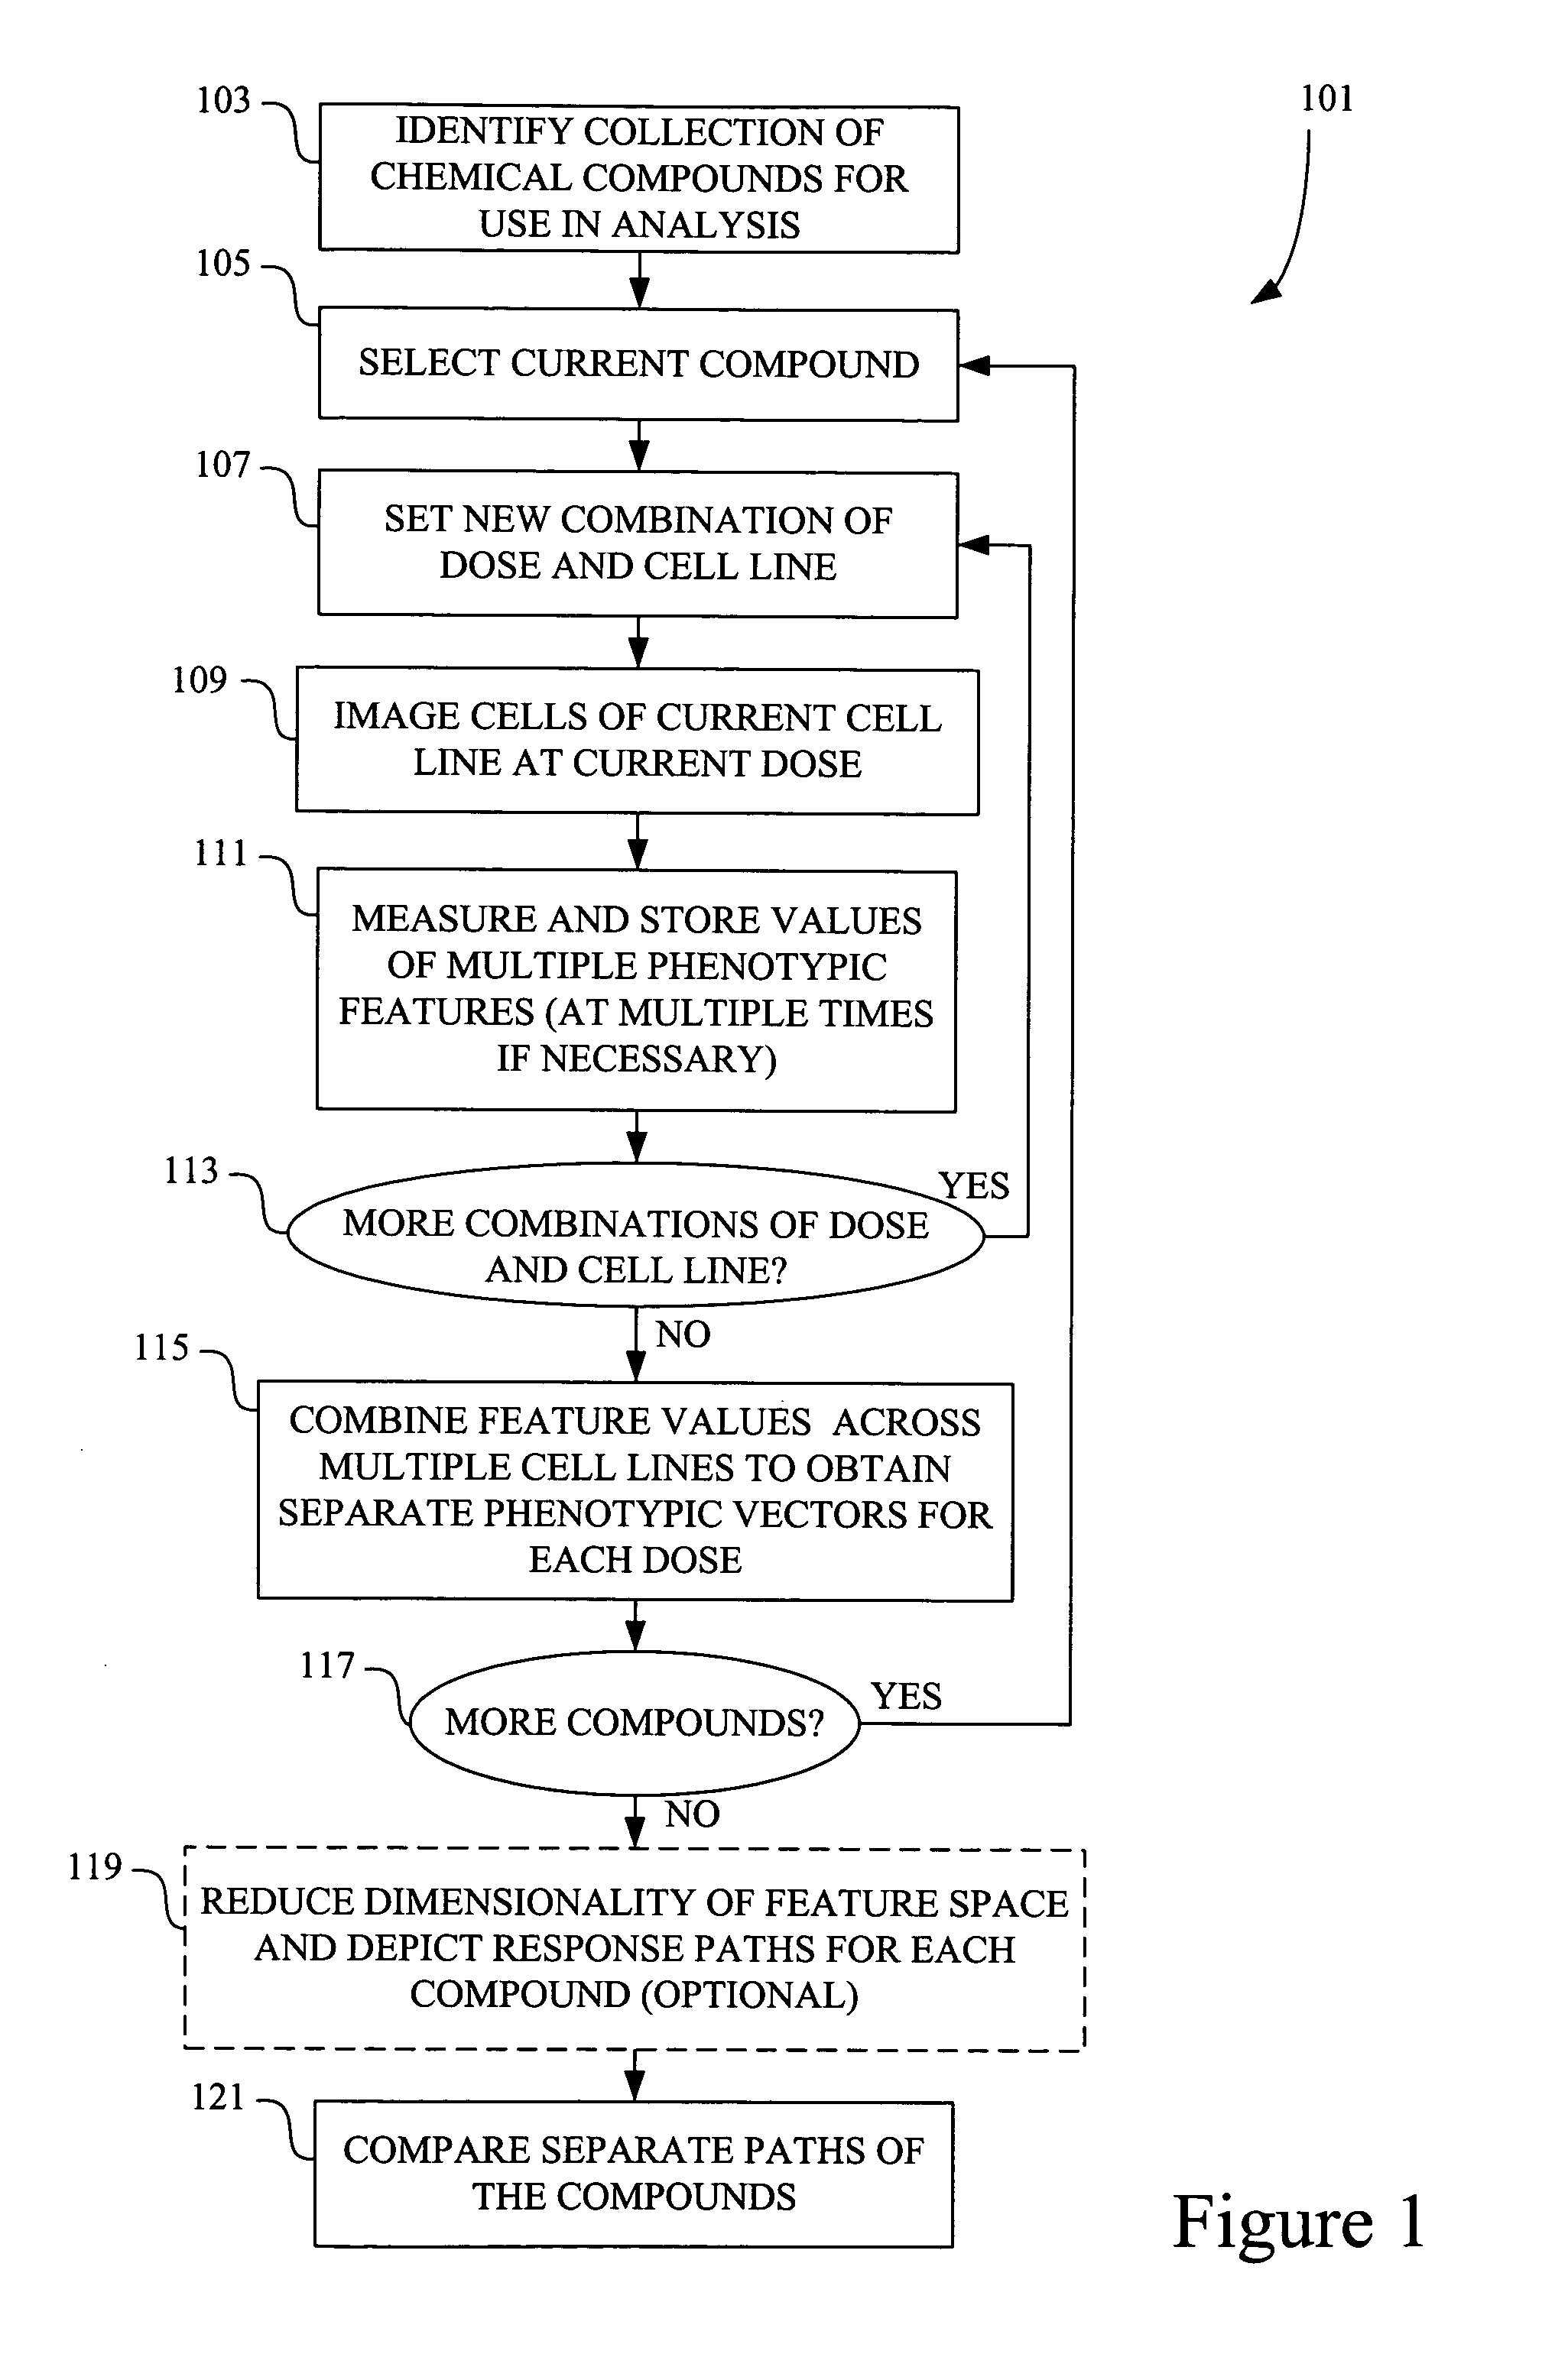
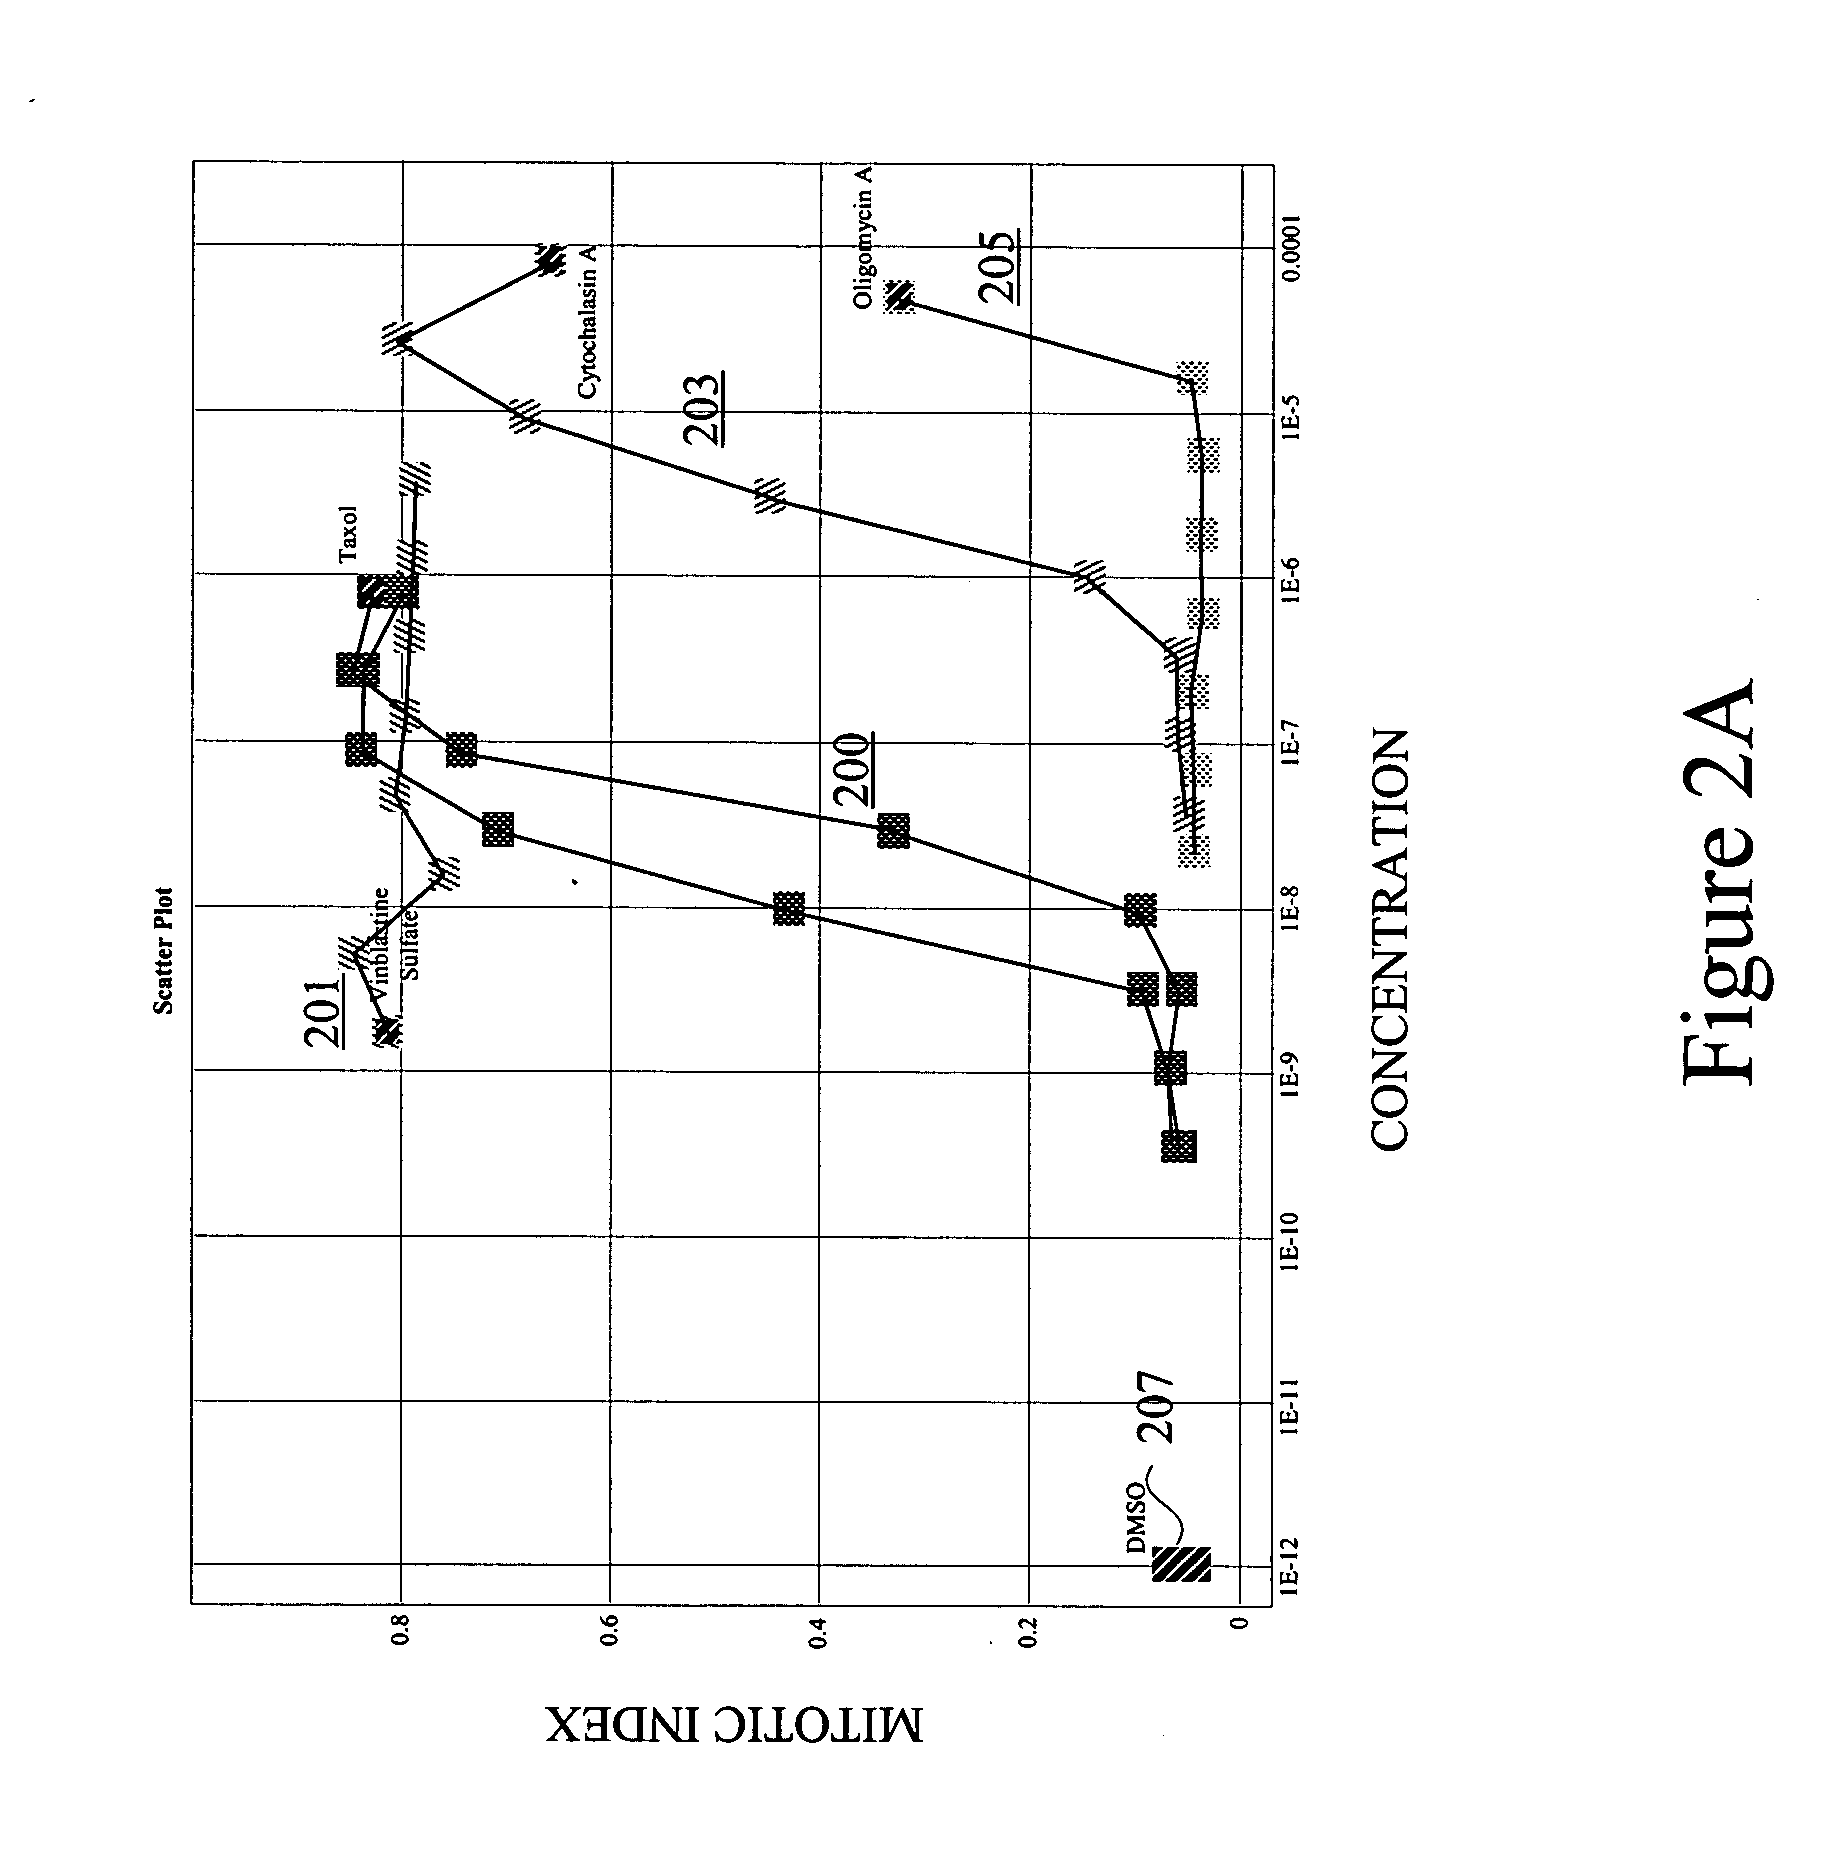
[0039] The present invention allows for comparison of response paths in multidimensional space. It also allows for comparison of a singular response (signature) and a response path. The response path(s) may span various levels of a stimulus, with each point in the path representing a different level of the stimulus. For example, each point might represent a different concentration or dose of chemical compound. Alternatively, each point in the path may represent a different time after initial exposure to a chemical compound. Other examples are presented below. Each point (signature) in the response path typically contains multivariate information about a cell's or population of cells' response to a particular level of the stimulus.

[0040] In many embodiments, the multivariate signatures of stimuli contain some phenotypic information about the cells affected by the stimuli. Such phenotypic information may provide morphological details, texture and intensity measure...


PUM

PropertyMeasurementUnit
radiusaaaaaaaaaa
separation distanceaaaaaaaaaa
common radiusaaaaaaaaaa

Abstract

A method for calculating distances between stimulus response curves (e.g., dose response curves) allows classification of stimuli. The response curves show how the phenotype of one or more cells changes in response to varying levels of the stimulus. Each “point” on the curve represents quantitative phenotype or signature for cell(s) at a particular level of stimulus (e.g., dose of a therapeutic). The signatures are multivariate phenotypic representations of the cell(s). They include various features of the cell(s) obtained by image analysis. To facilitate the comparison of stimuli, distances between points on the response curves are calculated. First, the response curves may be aligned on a coordinate representing a separate distance, r, from a common point of negative control (e.g., the point where no stimulus is applied). Integration on r may be used to compute the distance between two response curves. The distance between response curves is used to classify stimuli.

Description

CROSS-REFERENCE TO RELATED APPLICATIONS [0001] This application claims the benefit of U.S. Patent Application No. 60 / 509,040, filed Jul. 18, 2003, which is incorporated herein by reference for all purposes. [0002] This application is related to U.S. patent application Ser. No. 09 / 789,595 of Vaisberg et al., filed Feb. 20, 2001, and titled “CHARACTERIZING BIOLOGICAL STIMULI BY RESPONSE CURVES,” which is incorporated herein by reference for all purposes. [0003] This application is also related to the following co-pending U.S. patent applications, U.S. patent application Ser. No. 10 / 621,821, filed Jul. 16, 2003 in the names of Kutsyy et al., and titled METHODS AND APPARATUS FOR INVESTIGATING SIDE EFFECTS; U.S. patent application Ser. No. 09 / 310,879 by Vaisberg et al., and titled DATABASE METHOD FOR PREDICTIVE CELLULAR BIOINFORMATICS; U.S. patent application Ser. No. 09 / 311,996 by Vaisberg et al., and titled DATABASE SYSTEM INCLUDING COMPUTER FOR PREDICTIVE CELLULAR BIOINFORMATICS; U.S....

Claims


Application Information

Patent Timeline
Patent Type & Authority Applications(United States)
IPC IPC(8): A61K49/00G01N33/48G06FG06F19/00
CPCG06K9/00147G06K9/6274G06K9/00536G06V20/698G06F2218/12G06F18/24143A61K49/00G01N33/48G06F1/00
Inventor KUTSYY, VADIMCOLEMAN, DANIEL A.VAISBERG, EUGENI A.
Owner CYTOKINETICS INC
Why Eureka
Try Eureka