System and method for monitoring performance of groupings of network infrastructure and applications using statistical analysis

a network infrastructure and application technology, applied in the field of software and network system management, can solve the problems of large-scale failure of software patches and updates within enterprise environments, the complexity of the production environment in which these software applications are deployed has also increased, and the operator has to intervene. and the half of all software patches and updates within the enterprise environment fail when being applied, and the problem of the operator is even wors

Inactive Publication Date: 2006-01-26
K5 SYST
View PDF2 Cites 102 Cited by
  • Summary
  • Abstract
  • Description
  • Claims
  • Application Information

AI Technical Summary

Problems solved by technology

Furthermore, the production environments into which these software applications are being deployed have also increased in complexity and are often interlinked and inter-related with other ‘shared’ components.
For example, roughly half of all software patches and updates within enterprise environments fail when being applied and require some form IT operator intervention.
The issues are even worse when dealing with large scale applications that are designed and written by many different people, and when operating environments need to support large numbers of live users and transactions.
The core of the problem is rooted in the software release decision itself and the tradeoff that is made between the risks of downtime and application vulnerability.
All changes to the software code can have un-intended consequences to other applications or infrastructure components.
Thus far, the inability to quantify that risk in the deployment of software means that most decisions are made blindly, oftentimes with significant implications.
The problem is: how much testing is enough?
Ultimately, the complication is that the testing environments are simply different from production environments.
Furthermore, as infrastructure components are shared across multiple software applications, or when customers consume different combinations of components within a service environment, of when third party applications are utilized or embedded within an application, the current testing environments are rendered particularly insufficient.
As these applications have evolved and grown increasingly complex, so have the difficulties and expenses associated with managing and supporting them.
While these offer new techniques and advances, they are refinements of the existing systems rather than fundamentally new approaches to overall performance management.
In general, while these 3 categories of tools often provide IT operations staffs with a high degree of flexibility, these systems management tools also require extensive customization for each application deployment and have high on-going costs associated with changes made to the application and infrastructure.
Additionally, these tools are architected to focus on individual applications, servers or other discrete layer of the infrastructure and not well designed to suit the needs of managing performance across complex and heterogeneous multi-application systems.

Method used


Image

  • System and method for monitoring performance of groupings of network infrastructure and applications using statistical analysis
  • System and method for monitoring performance of groupings of network infrastructure and applications using statistical analysis
  • System and method for monitoring performance of groupings of network infrastructure and applications using statistical analysis

Examples


Embodiment Construction

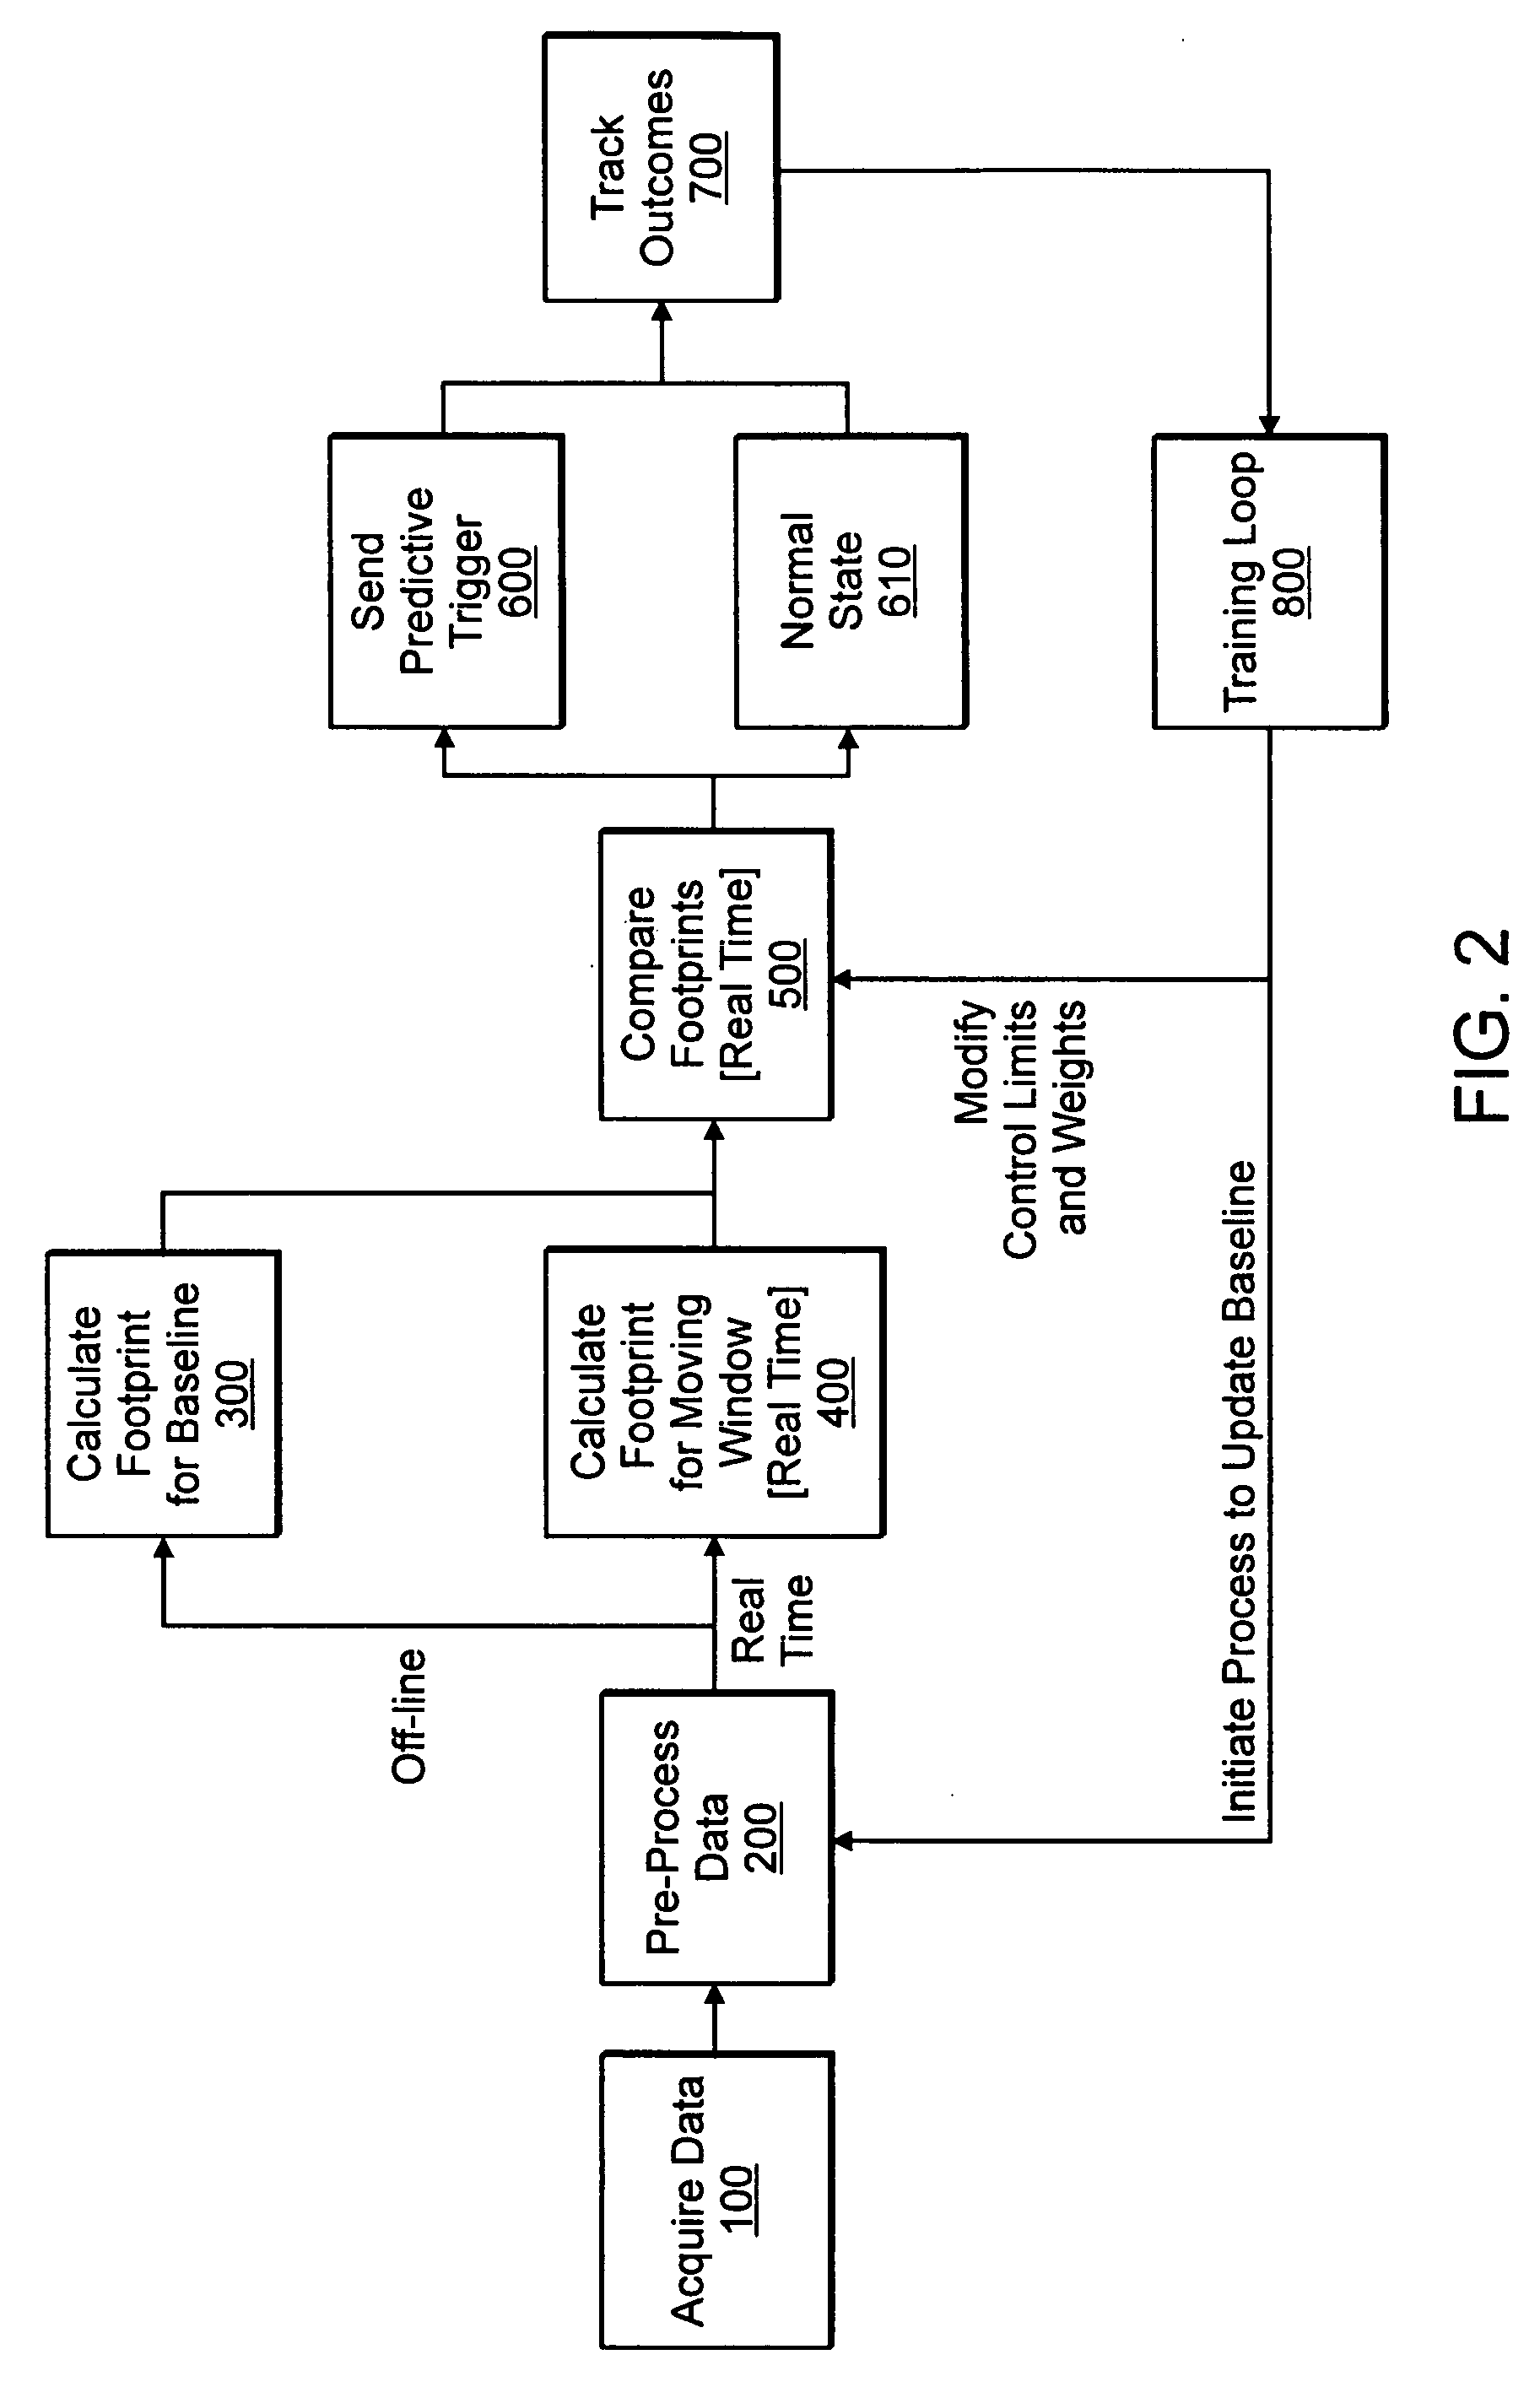
[0048] Preferred embodiments of the invention provide a method, system and computer program that simultaneously manages multiple, flexible groupings of software and infrastructure components based on real time deviations from an expected normative behavioral pattern (Footprint).

[0049] Footprint: Each Footprint is a statistical description of an expected pattern of behavior for a particular grouping of client applications and infrastructure components (Managed Unit). This Footprint is calculated using a set of mathematical and statistical techniques; it contains a set of numerical values that describe various statistical parameters. Additionally, a set of user configured and trainable weights as well as a composite control limit are also calculated and included as a part of the Footprint.

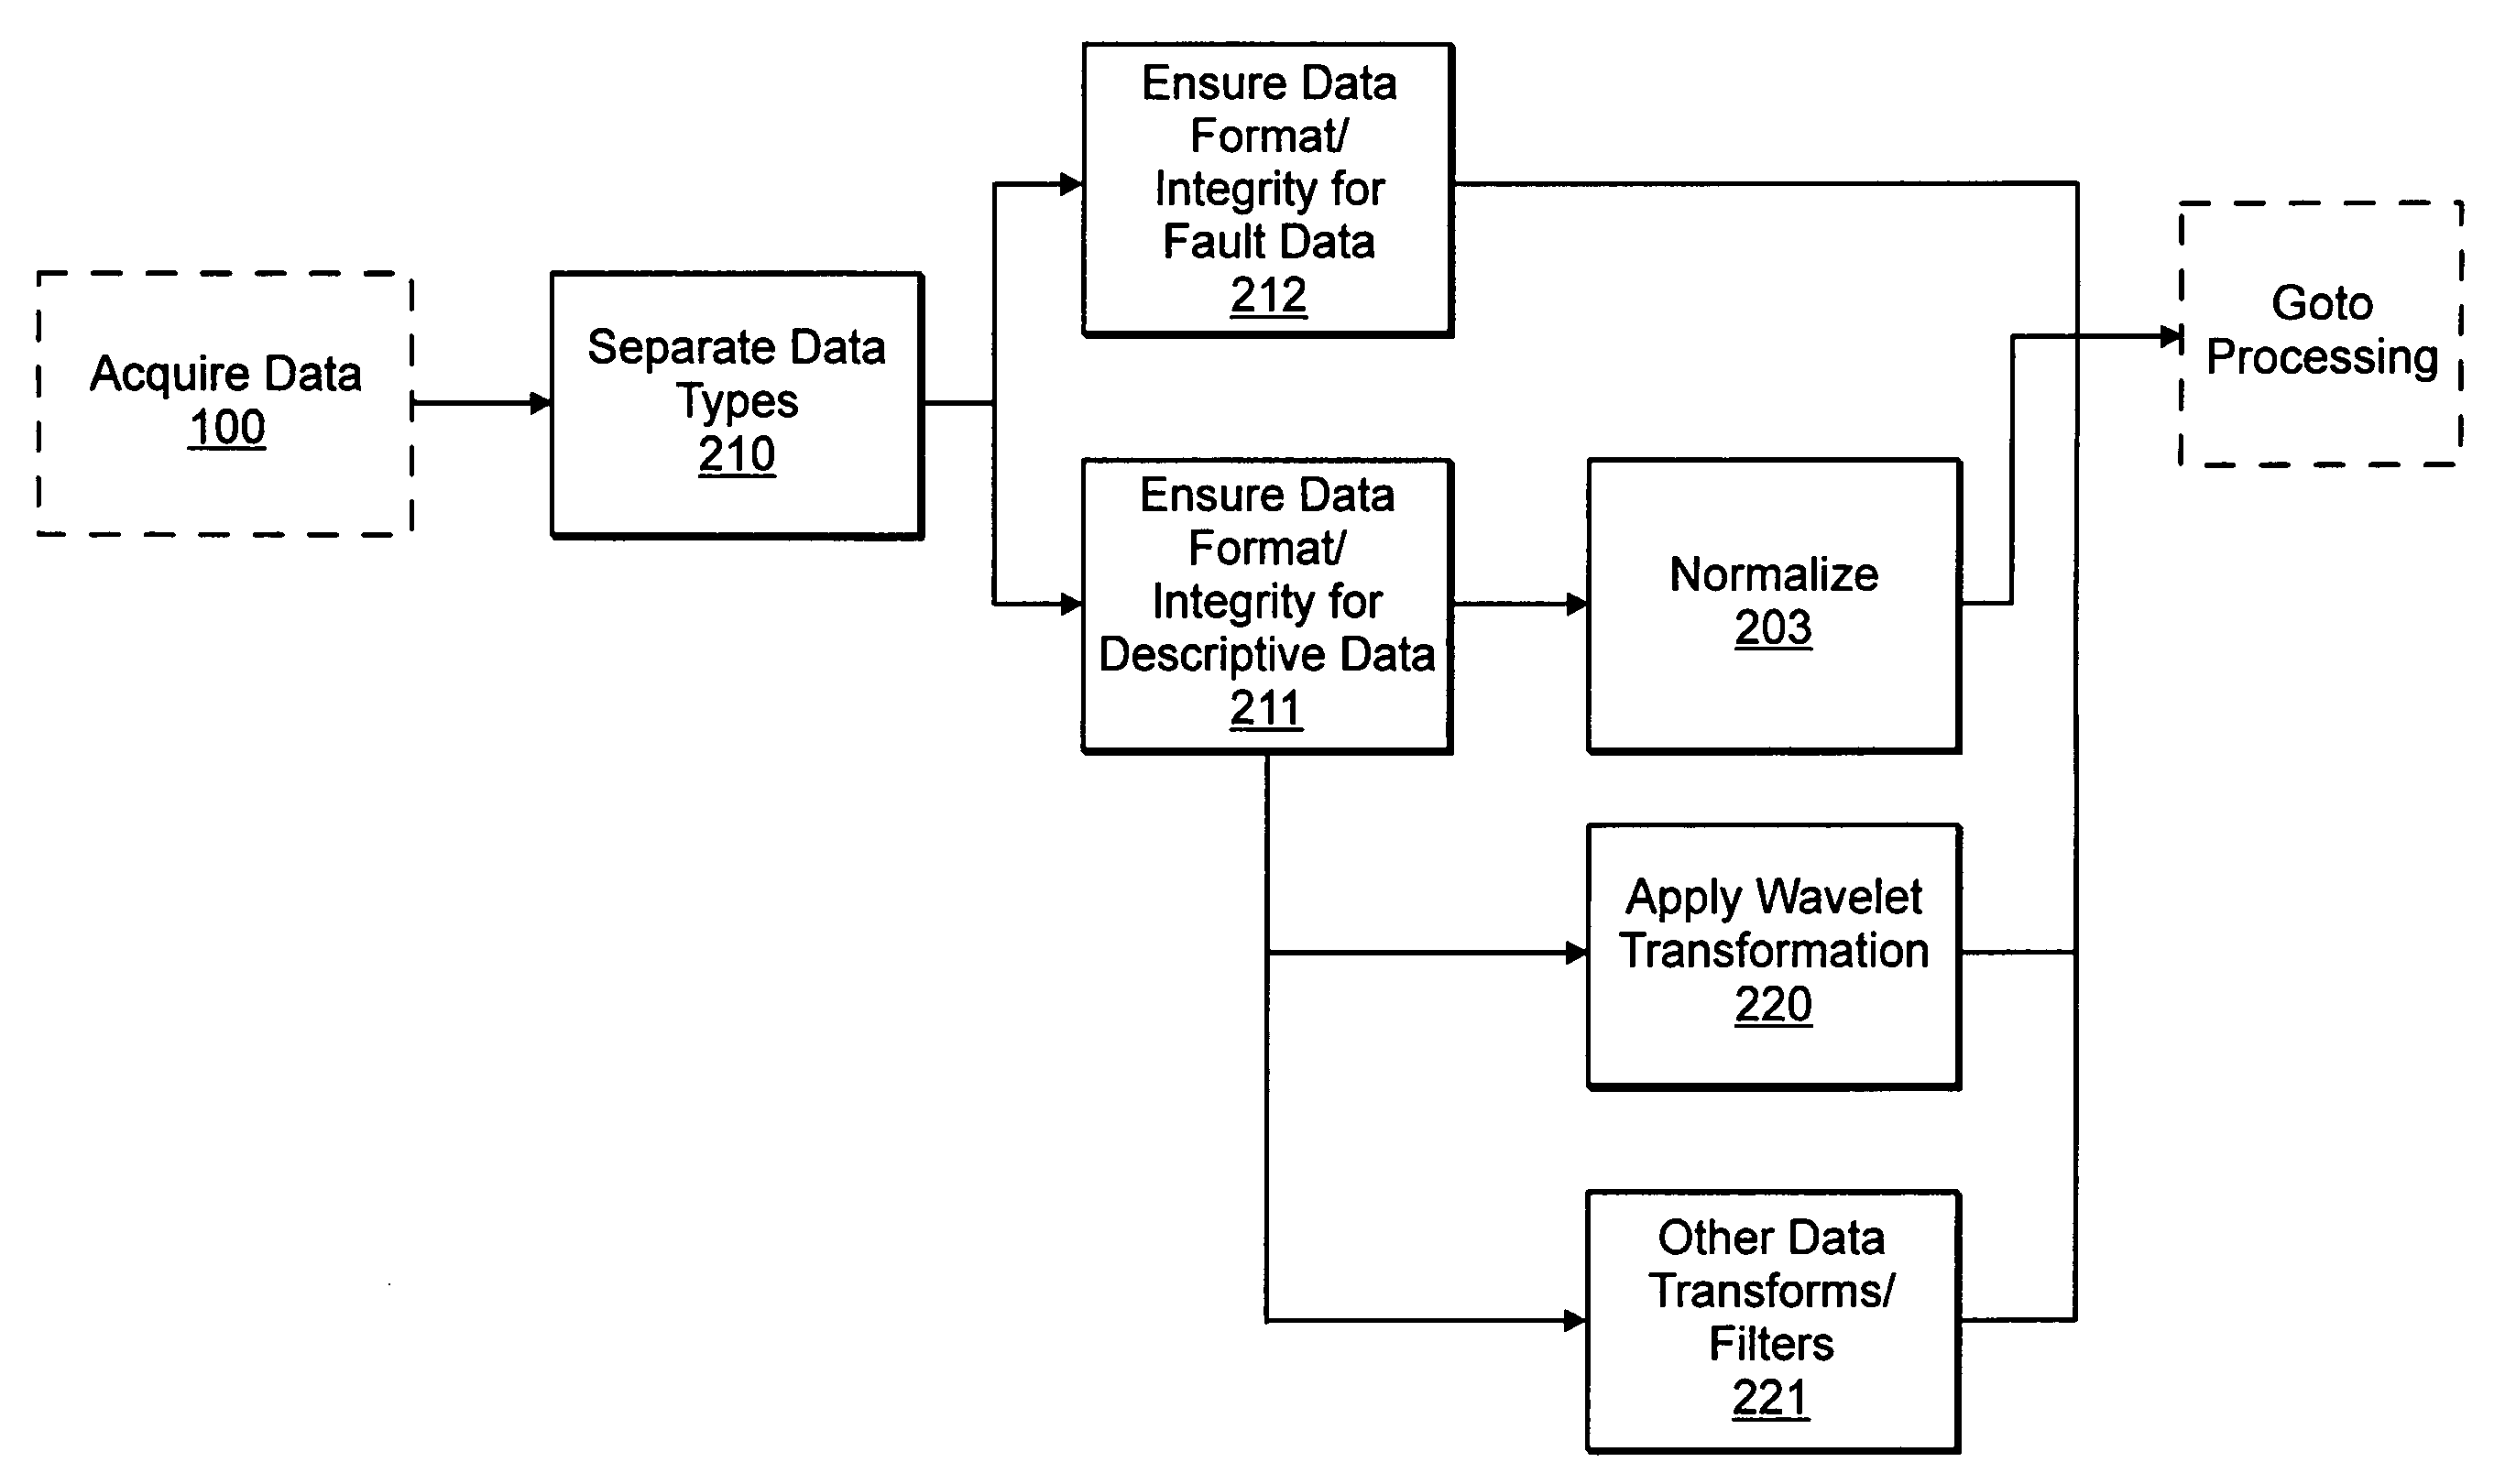
[0050] Input Data: These calculations are performed on a variety of input data for each Managed Unit. The input data can be categorized into two broad types: (a) Descriptive data such as monitored ...


PUM


Abstract

Systems, methods and computer program products for monitoring performance of groupings of network infrastructure and applications using statistical analysis. A method, system and computer program monitors managed unit groupings of executing software applications and execution infrastructure to detect deviations in performance. Logic acquires time-series data from at least one managed unit grouping of executing software applications and execution infrastructure. Other logic derives a statistical description of expected behavior from an initial set of acquired data. Logic derives a statistical description of operating behavior from acquired data corresponding to a defined moving window of time slots. Logic compares the statistical description of expected behavior with the statistical description of operating behavior; and logic reports predictive triggers, said logic to report being responsive to said logic to compare and said logic to report identifying instances where the statistical description of operating behavior deviates from statistical description of operating behavior to indicates a statistically significant probability that an operating anomaly exists within the at least managed unit grouping corresponding to the acquired time-series data.

Description

CROSS-REFERENCE TO RELATED CASES [0001] This application claims priority under 35 U.S.C. §119(e) to U.S. Provisional Patent Application Nos. 60 / 579,984 filed on Jun. 15, 2004, entitled Methods and Systems for Determining and Using a Software Footprint, which is incorporated herein by reference in their entirety. [0002] This application is related to the following U.S. patent applications (Ser. Nos. ______ TBA), filed on an even date herewith, entitled as follows: [0003] System and Method for Monitoring Performance of Arbitrary Groupings of Network Infrastructure and Applications; [0004] System and Method for Monitoring Performance of Network Infrastructure and Applications by Automatically Identifying System Variables or Components Constructed from Such Variables that Dominate Variance of Performance; and [0005] Method for Using Statistical Analysis to Monitor and Analyze Performance of New Network Infrastructure or Software Applications Before Deployment Thereof.BACKGROUND [0006] 1...

Claims


Application Information

Patent Timeline
Patent Type & Authority Applications(United States)
IPC IPC(8): G06F9/44G06F9/445H04L12/24H04L12/26
CPCG06F11/0709H04L67/22G06F11/3419G06F11/3447G06F11/3466G06F11/3495G06F2201/81G06F2201/865H04L12/2602H04L41/0213H04L41/0681H04L41/0893H04L41/142H04L41/147H04L41/5009H04L41/5032H04L41/5054H04L41/5064H04L43/00H04L43/028H04L43/065H04L43/067H04L43/16G06F11/3452G06F2201/835G06F11/0751H04L67/535
Inventor LO, KEVIN H.CHUNG, RICHARD Y.
Owner K5 SYST
Why Eureka
Try Eureka