System and methods for navigating and visualizing multi-dimensional biological data

a biological or chemical dataset and multi-dimensional technology, applied in the direction of instruments, analogue processes for specific applications, image generation, etc., can solve the problems of many different forms of large datasets, difficulty in displaying and manipulating, and difficulty in identifying and comparing results, so as to facilitate identification, correlation or other useful relationships, facilitate user's ability to maintain reference, and facilitate the effect of displaying and manipulating

Inactive Publication Date: 2006-02-16
AGILENT TECH INC
View PDF5 Cites 109 Cited by
  • Summary
  • Abstract
  • Description
  • Claims
  • Application Information

AI Technical Summary

Benefits of technology

[0016] The present invention provides methods, systems and computer readable media for displaying and manipulating a large dataset to facilitate identification, correlations or other useful relationships among the data in the dataset. Such displaying and manipulating may be facilitated by generating a planar view of a two-dimensional projection of the data in the dataset; continuously zooming the planar view, to provide a zoomed-in or a zoomed out view of at least a portion of the data, wherein the continuous zooming feature facilitates a user's ability to maintain reference; converting an abstraction of at least a portion of the data to a different level of abstraction during said continuously zooming step when a predetermined level of zooming-in has been reached, and converting the different level of abstraction back to the abstraction of the at least a portion of the data when a predetermined level of zooming-out has been reached.

Problems solved by technology

Working with extremely large datasets can be problematic to a researcher in terms of trying to maintain an appropriate amount of detail of the subject data being examined, while at the same time maintaining sufficient context of the surrounding data.
This problem is amplified when the data of interest is extremely sparse, spread out over a very large dataset.
In the biological field, these problems present with respect to many different forms of large datasets that researchers need to study.
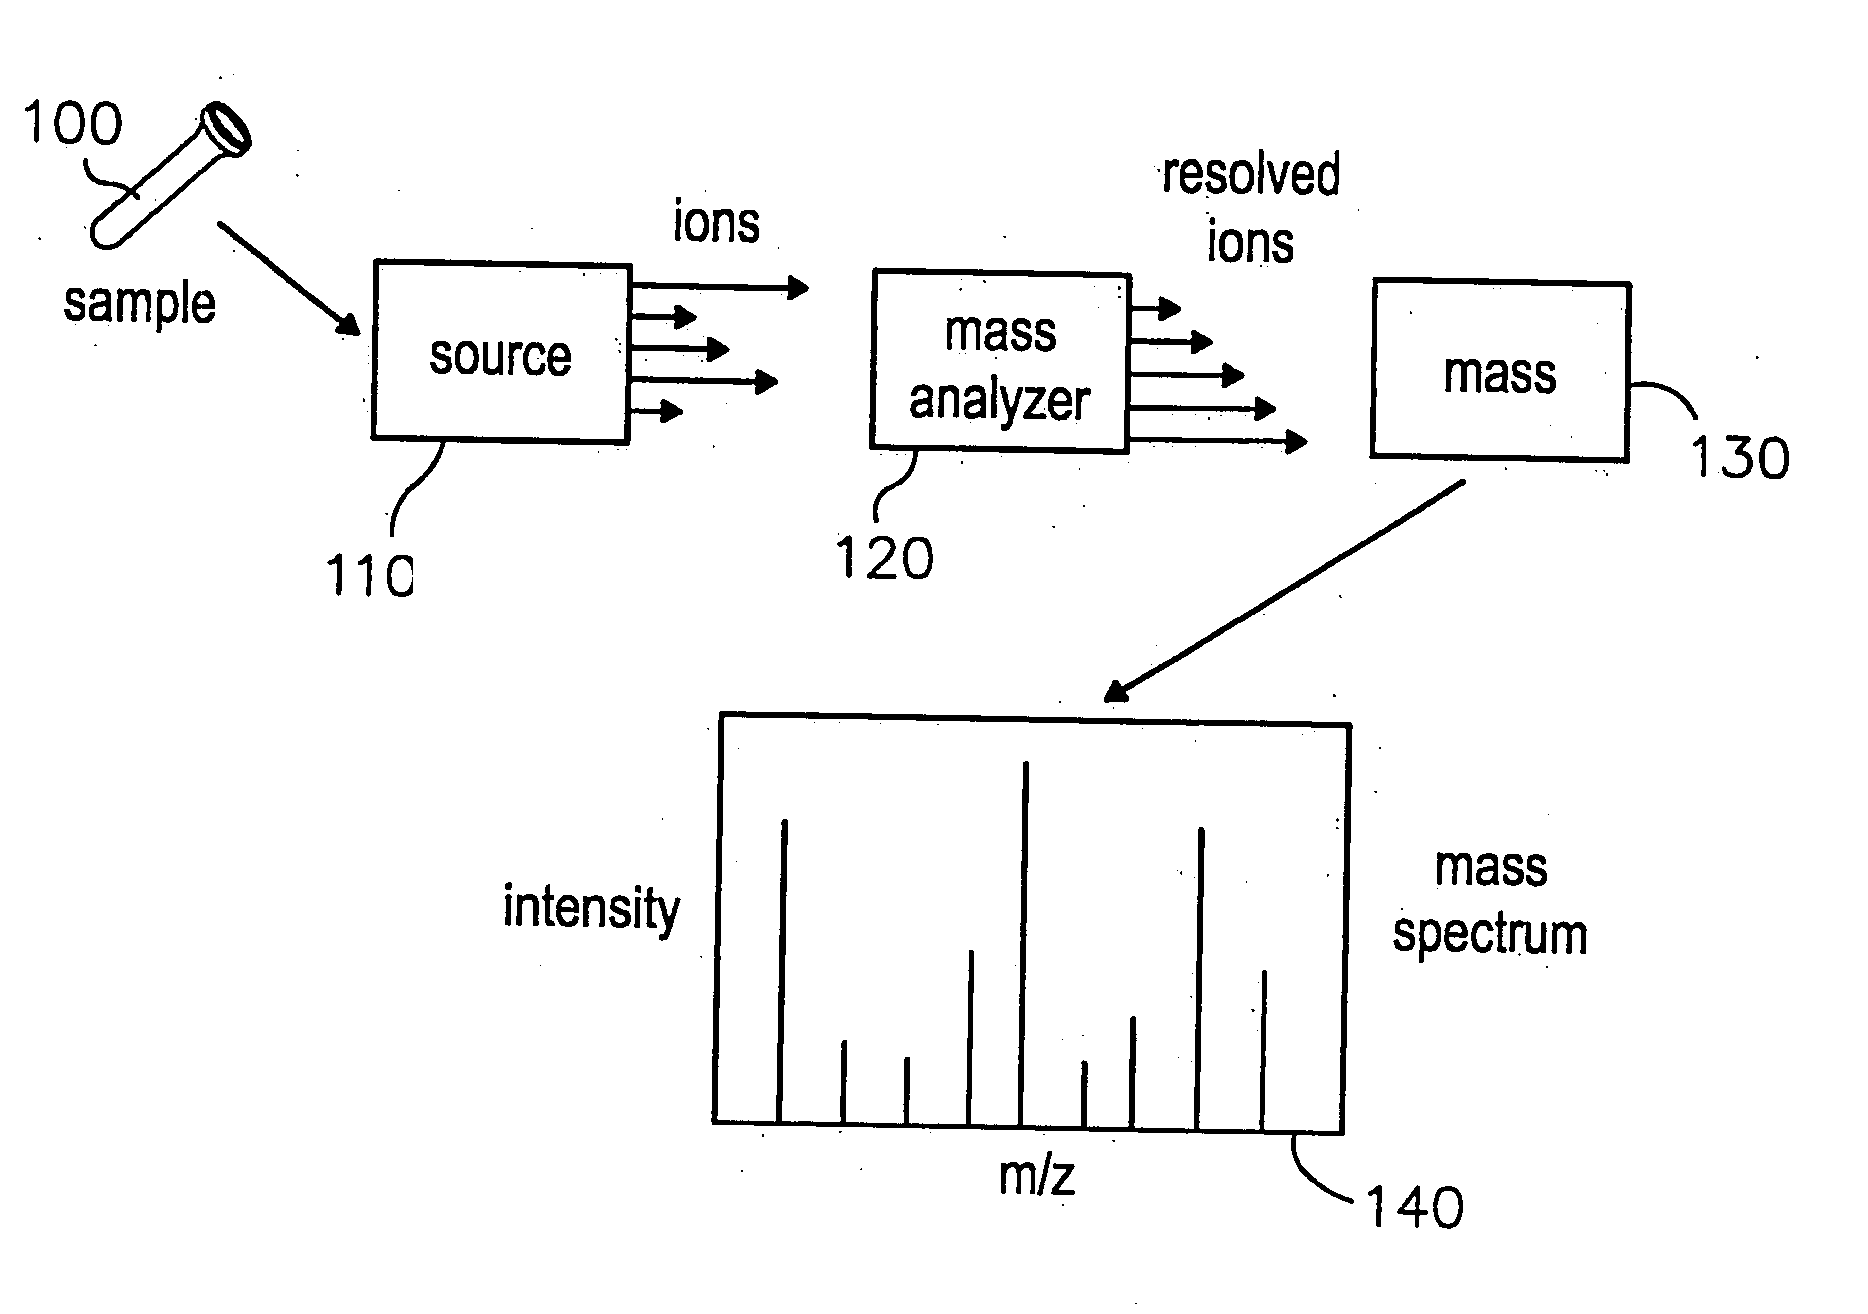
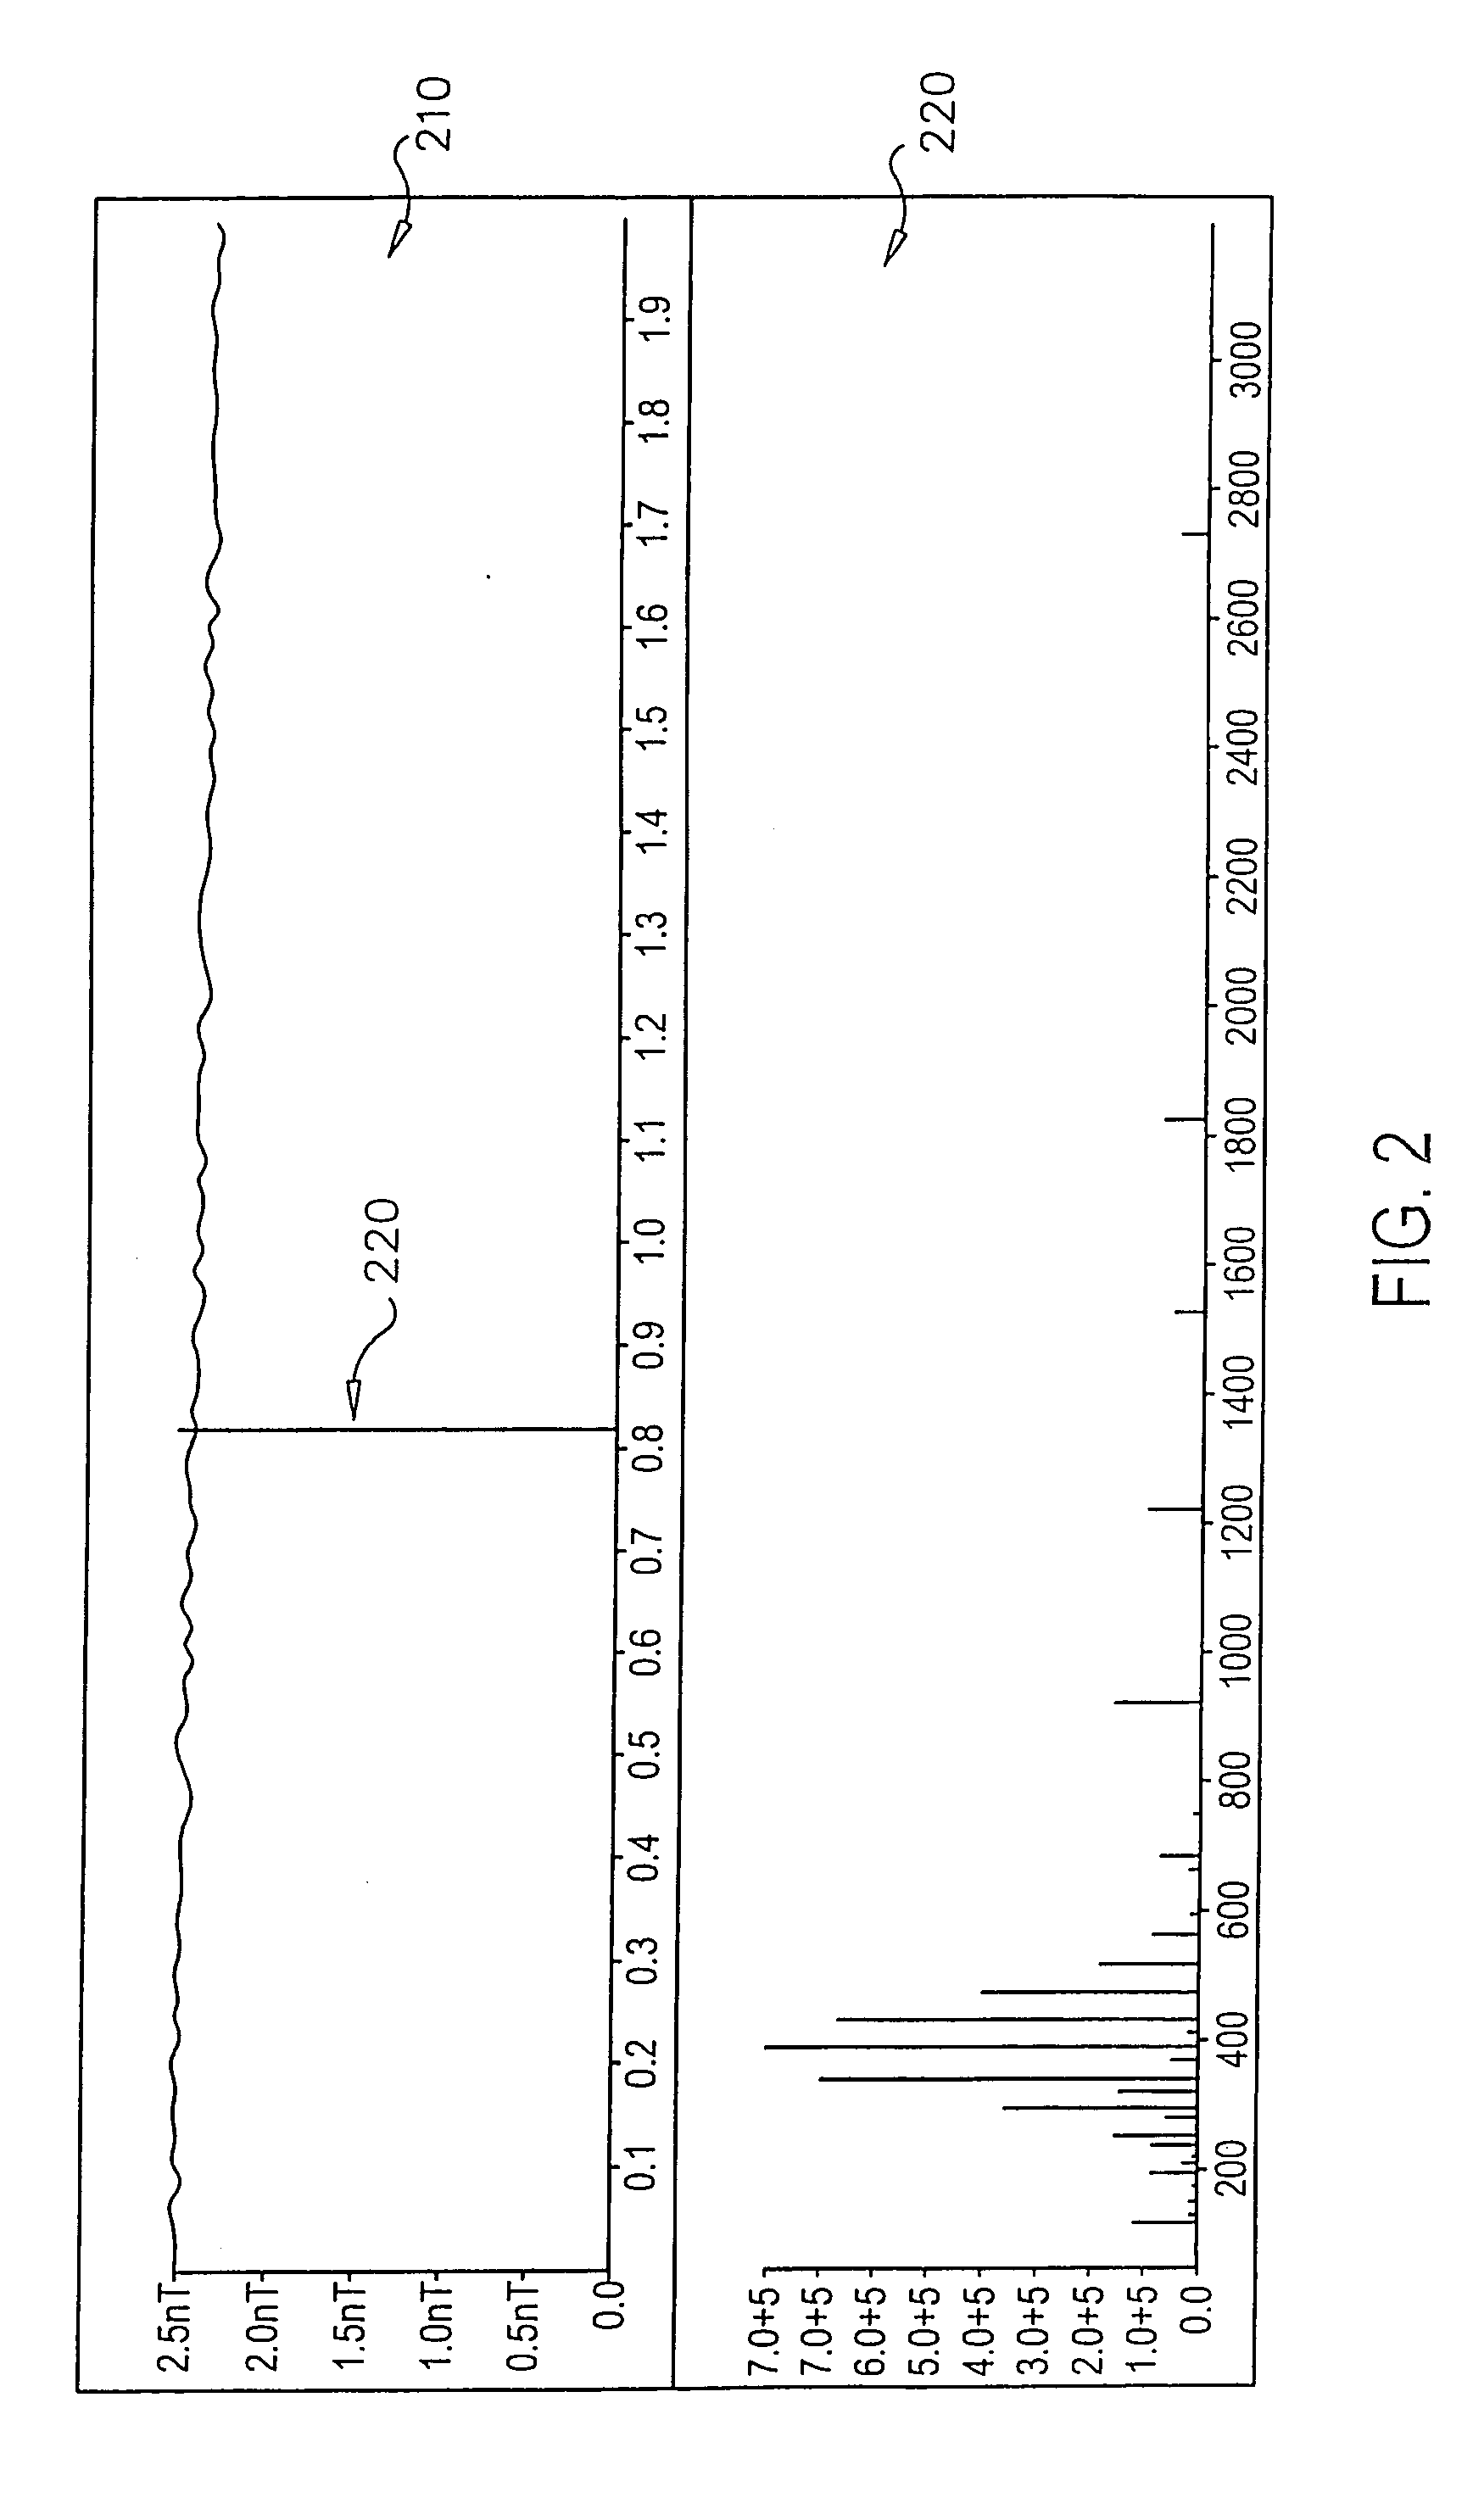
Additionally, experimental artifacts such as chemical pollution in the source of the mass spectrometer are typically quite visible.
Existing software for viewing and interacting with mass spectra is quite complex because there can be hundreds of thousands of compounds involved in the analysis of a typical sample.
Thus, while these approaches may provide sufficient detail of the data, they do so while significantly losing context of the surrounding data from which the narrow cross section is taken.
This is due to the fact that datasets are enormous and sparse.
This, in general, is slow and cumbersome.
Because mass spectrometry data is usually sparse and fine-featured, the simple display of scaled down mass spectral data is hard to read.
Thus, information is lost when the image is zoomed out to a low degree of magnification, as features in the display of the data blend into each other.
Although some software systems provide the capability of zooming in and out from detailed views to high level views, these views are not generally continuously zoomable, but must be redrawn at different magnifications, which requires time and the user loses a sense of continuity as well, which can be detrimental to his / her sense of context.
Additionally, the state of the art for comparing multiple mass spectrometry data sets is fairly primitive.
Thus, there is no widely accepted solution to the problem of comparing multiple datasets.
These systems are not adapted to searching large, sparse datasets such as mass spectrometry data.

Method used


Image

  • System and methods for navigating and visualizing multi-dimensional biological data
  • System and methods for navigating and visualizing multi-dimensional biological data
  • System and methods for navigating and visualizing multi-dimensional biological data

Examples


Embodiment Construction

[0059] Before the present methods, tools and system are described, it is to be understood that this invention is not limited to particular data sets, manipulations, tools or steps described, as such may, of course, vary. It is also to be understood that the terminology used herein is for the purpose of describing particular embodiments only, and is not intended to be limiting, since the scope of the present invention will be limited only by the appended claims.

[0060] Where a range of values is provided, it is understood that each intervening value, to the tenth of the unit of the lower limit unless the context clearly dictates otherwise, between the upper and lower limits of that range is also specifically disclosed. Each smaller range between any stated value or intervening value in a stated range and any other stated or intervening value in that stated range is encompassed within the invention. The upper and lower limits of these smaller ranges may independently be included or ex...


PUM


Abstract

Methods systems and computer readable media for manipulating and displaying sparse data contained within very large datasets. Particular applications includes those to proteomics and metabolomics. Navigation of the large data sets from a global perspective may be practically implemented, so that a user is not confined to a narrow slice of data at a time, thus providing context of the whole dataset while viewing data within the dataset.

Description

FIELD OF THE INVENTION [0001] The present invention pertains to the navigation and visualization of large datasets. More particularly, the present invention relates to navigation and visualization of large, multi-dimensional biological or chemical datasets generated by high-throughput experimental procedures. BACKGROUND OF THE INVENTION [0002] Working with extremely large datasets can be problematic to a researcher in terms of trying to maintain an appropriate amount of detail of the subject data being examined, while at the same time maintaining sufficient context of the surrounding data. This problem is amplified when the data of interest is extremely sparse, spread out over a very large dataset. [0003] In the biological field, these problems present with respect to many different forms of large datasets that researchers need to study. With the advent of high throughput technologies, dataset sizes and the volumes of data available for the researcher to access have grown by magnitu...

Claims


Application Information

Patent Timeline
Patent Type & Authority Applications(United States)
IPC IPC(8): G06F9/45
CPCG06F19/26G06T2210/36G06T11/206G16B45/00
Inventor LE COCQ, CHRISTIAN A.GRIMM, RUDOLF
Owner AGILENT TECH INC
Why Eureka
Try Eureka