Call stack capture in an interrupt driven architecture

a call stack and interrupt technology, applied in the direction of multi-programming arrangements, program control, instruments, etc., can solve the problems of increasing the performance of a program, high overhead associated with the profiler, etc., and achieve the effect of simplifying the work of capturing the thread's call stack

Inactive Publication Date: 2006-03-16
MICROSOFT TECH LICENSING LLC
View PDF1 Cites 58 Cited by
  • Summary
  • Abstract
  • Description
  • Claims
  • Application Information

AI Technical Summary

Benefits of technology

[0007] According to another aspect of the invention, code is injected into a thread to help simplify the work to capture a thread's call stack. The state of the thread is altered to induce the thread to invoke the kernel's call stack API itself, using its own context.

Problems solved by technology

Increasing the performance of a program can be a difficult task.
In order to measure the resources being consumed, however, the program being measured must include the instrumentation necessary to measure execution times. This can result in high overhead associated with the profiler.

Method used


Image

  • Call stack capture in an interrupt driven architecture
  • Call stack capture in an interrupt driven architecture
  • Call stack capture in an interrupt driven architecture

Examples


Embodiment Construction

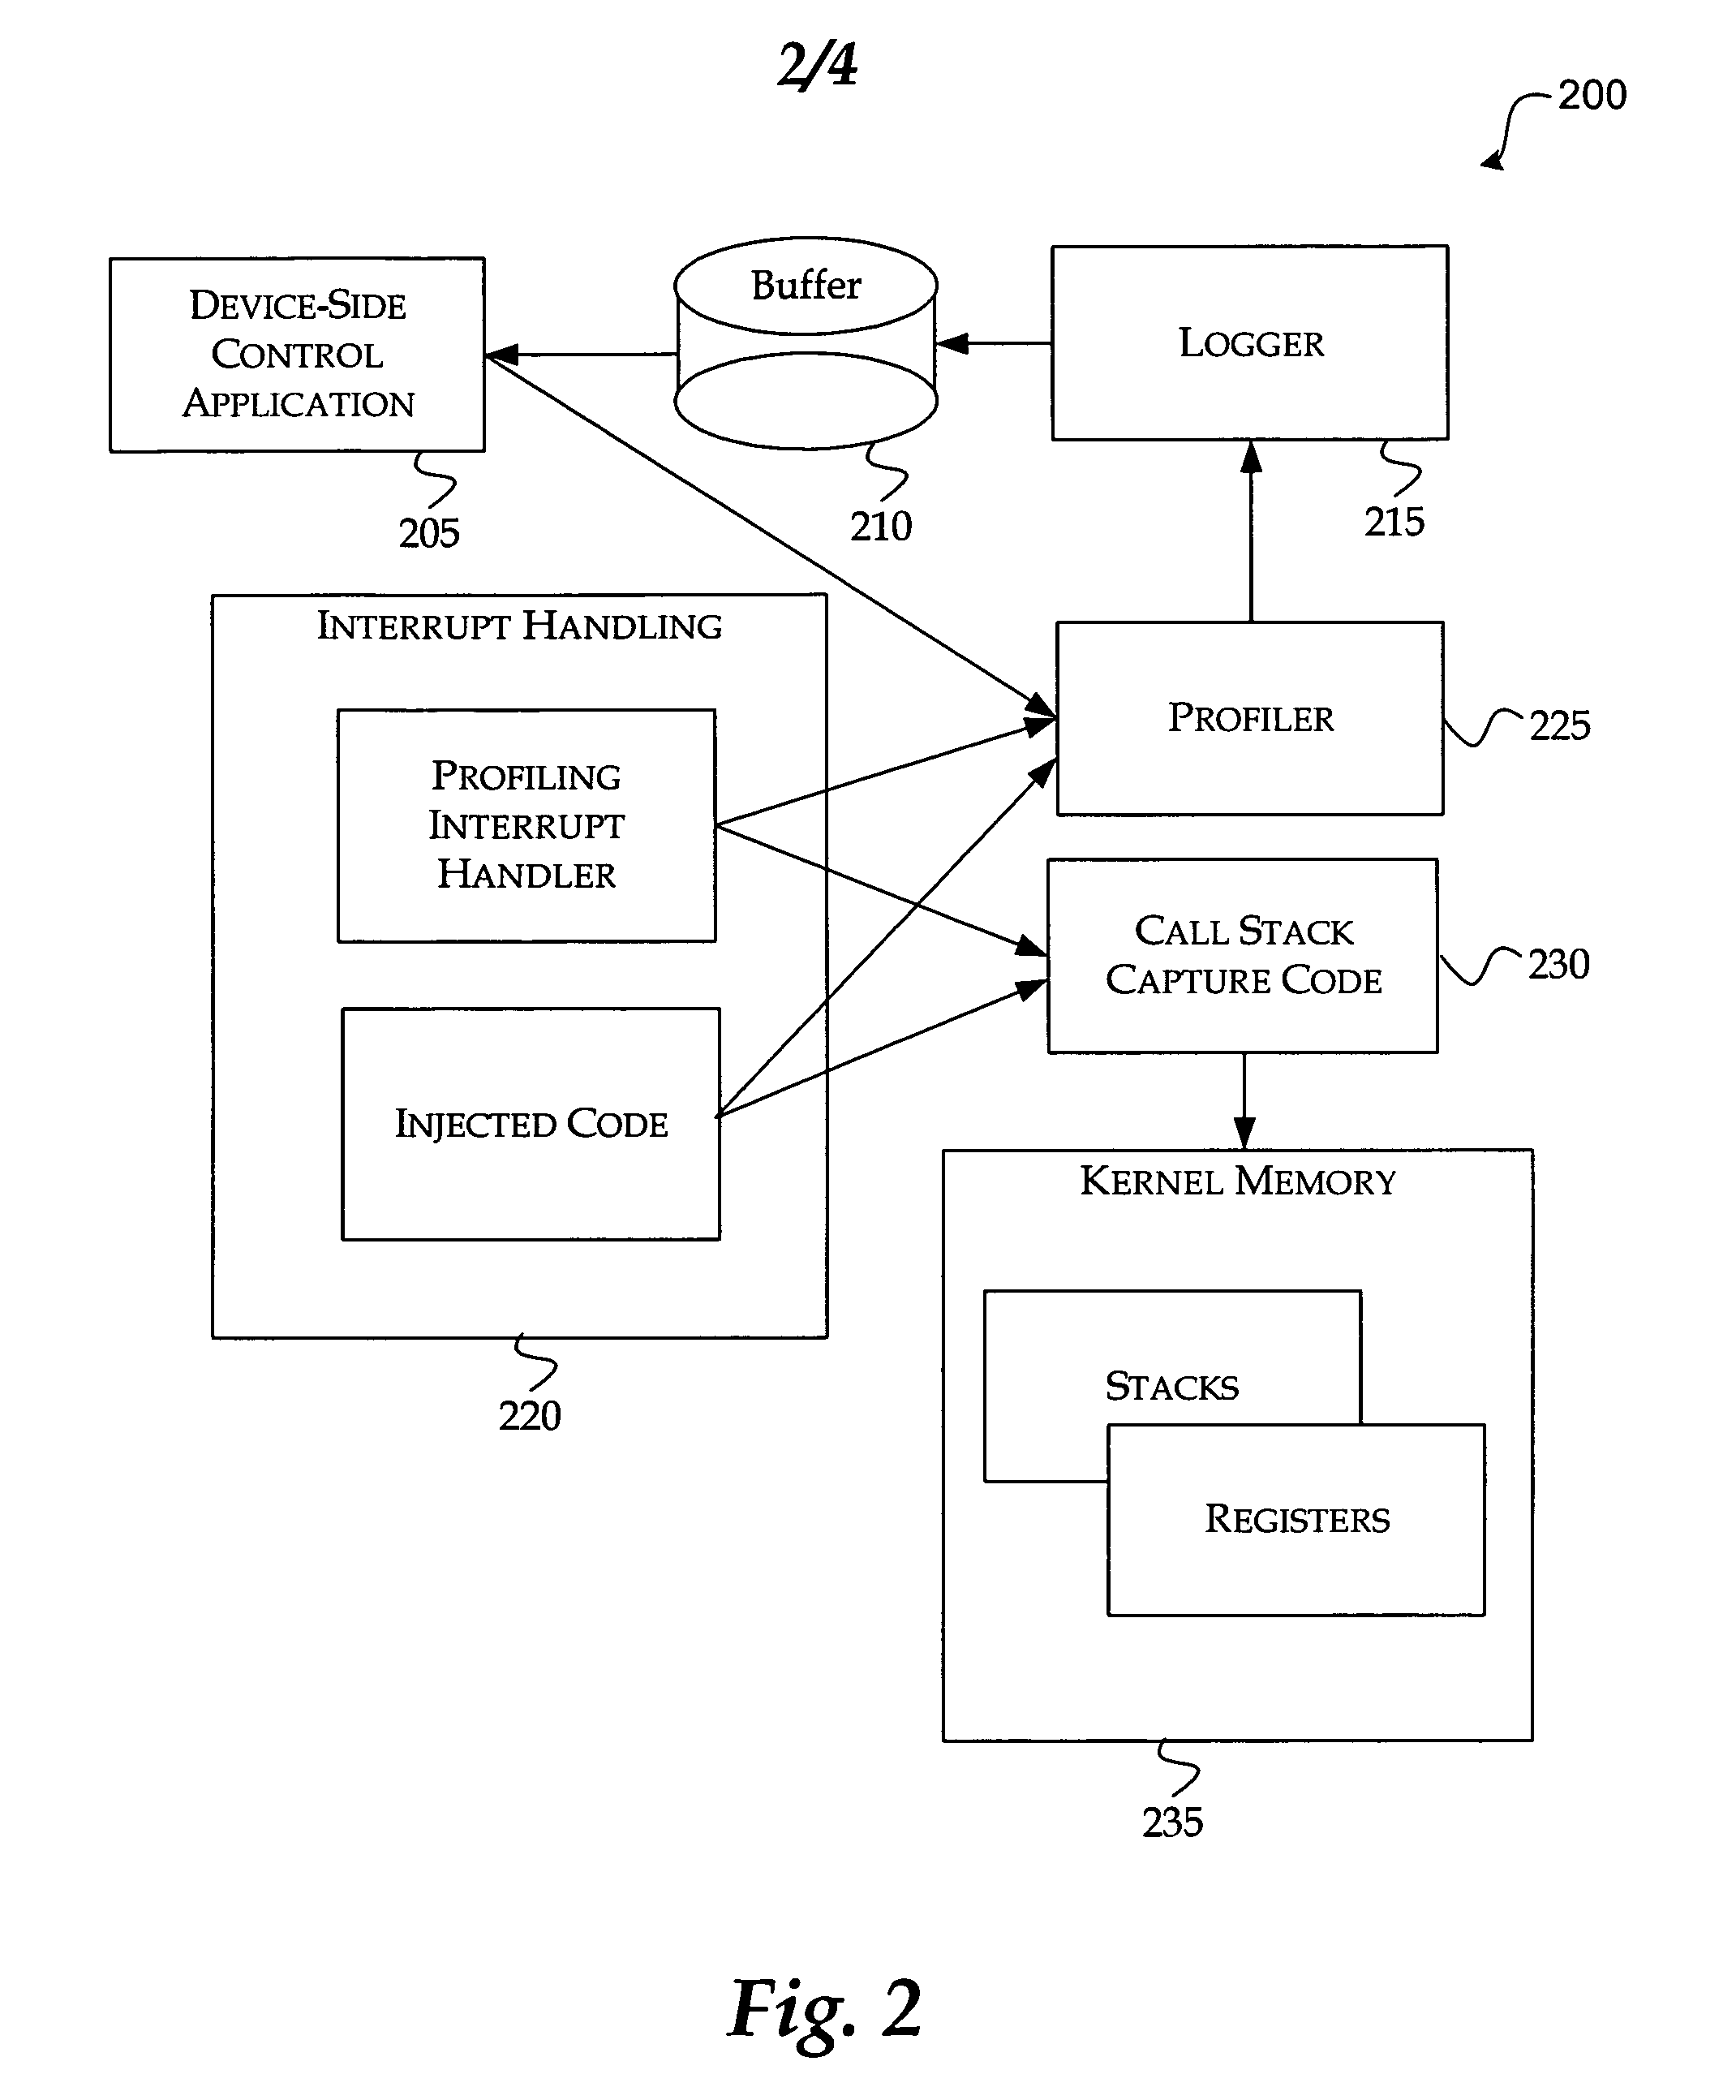
[0012] Generally, The present invention is directed at providing a system and method for capturing the call stack of a currently-running thread at the time a profiler interrupt occurs.

Illustrative Operating Environment

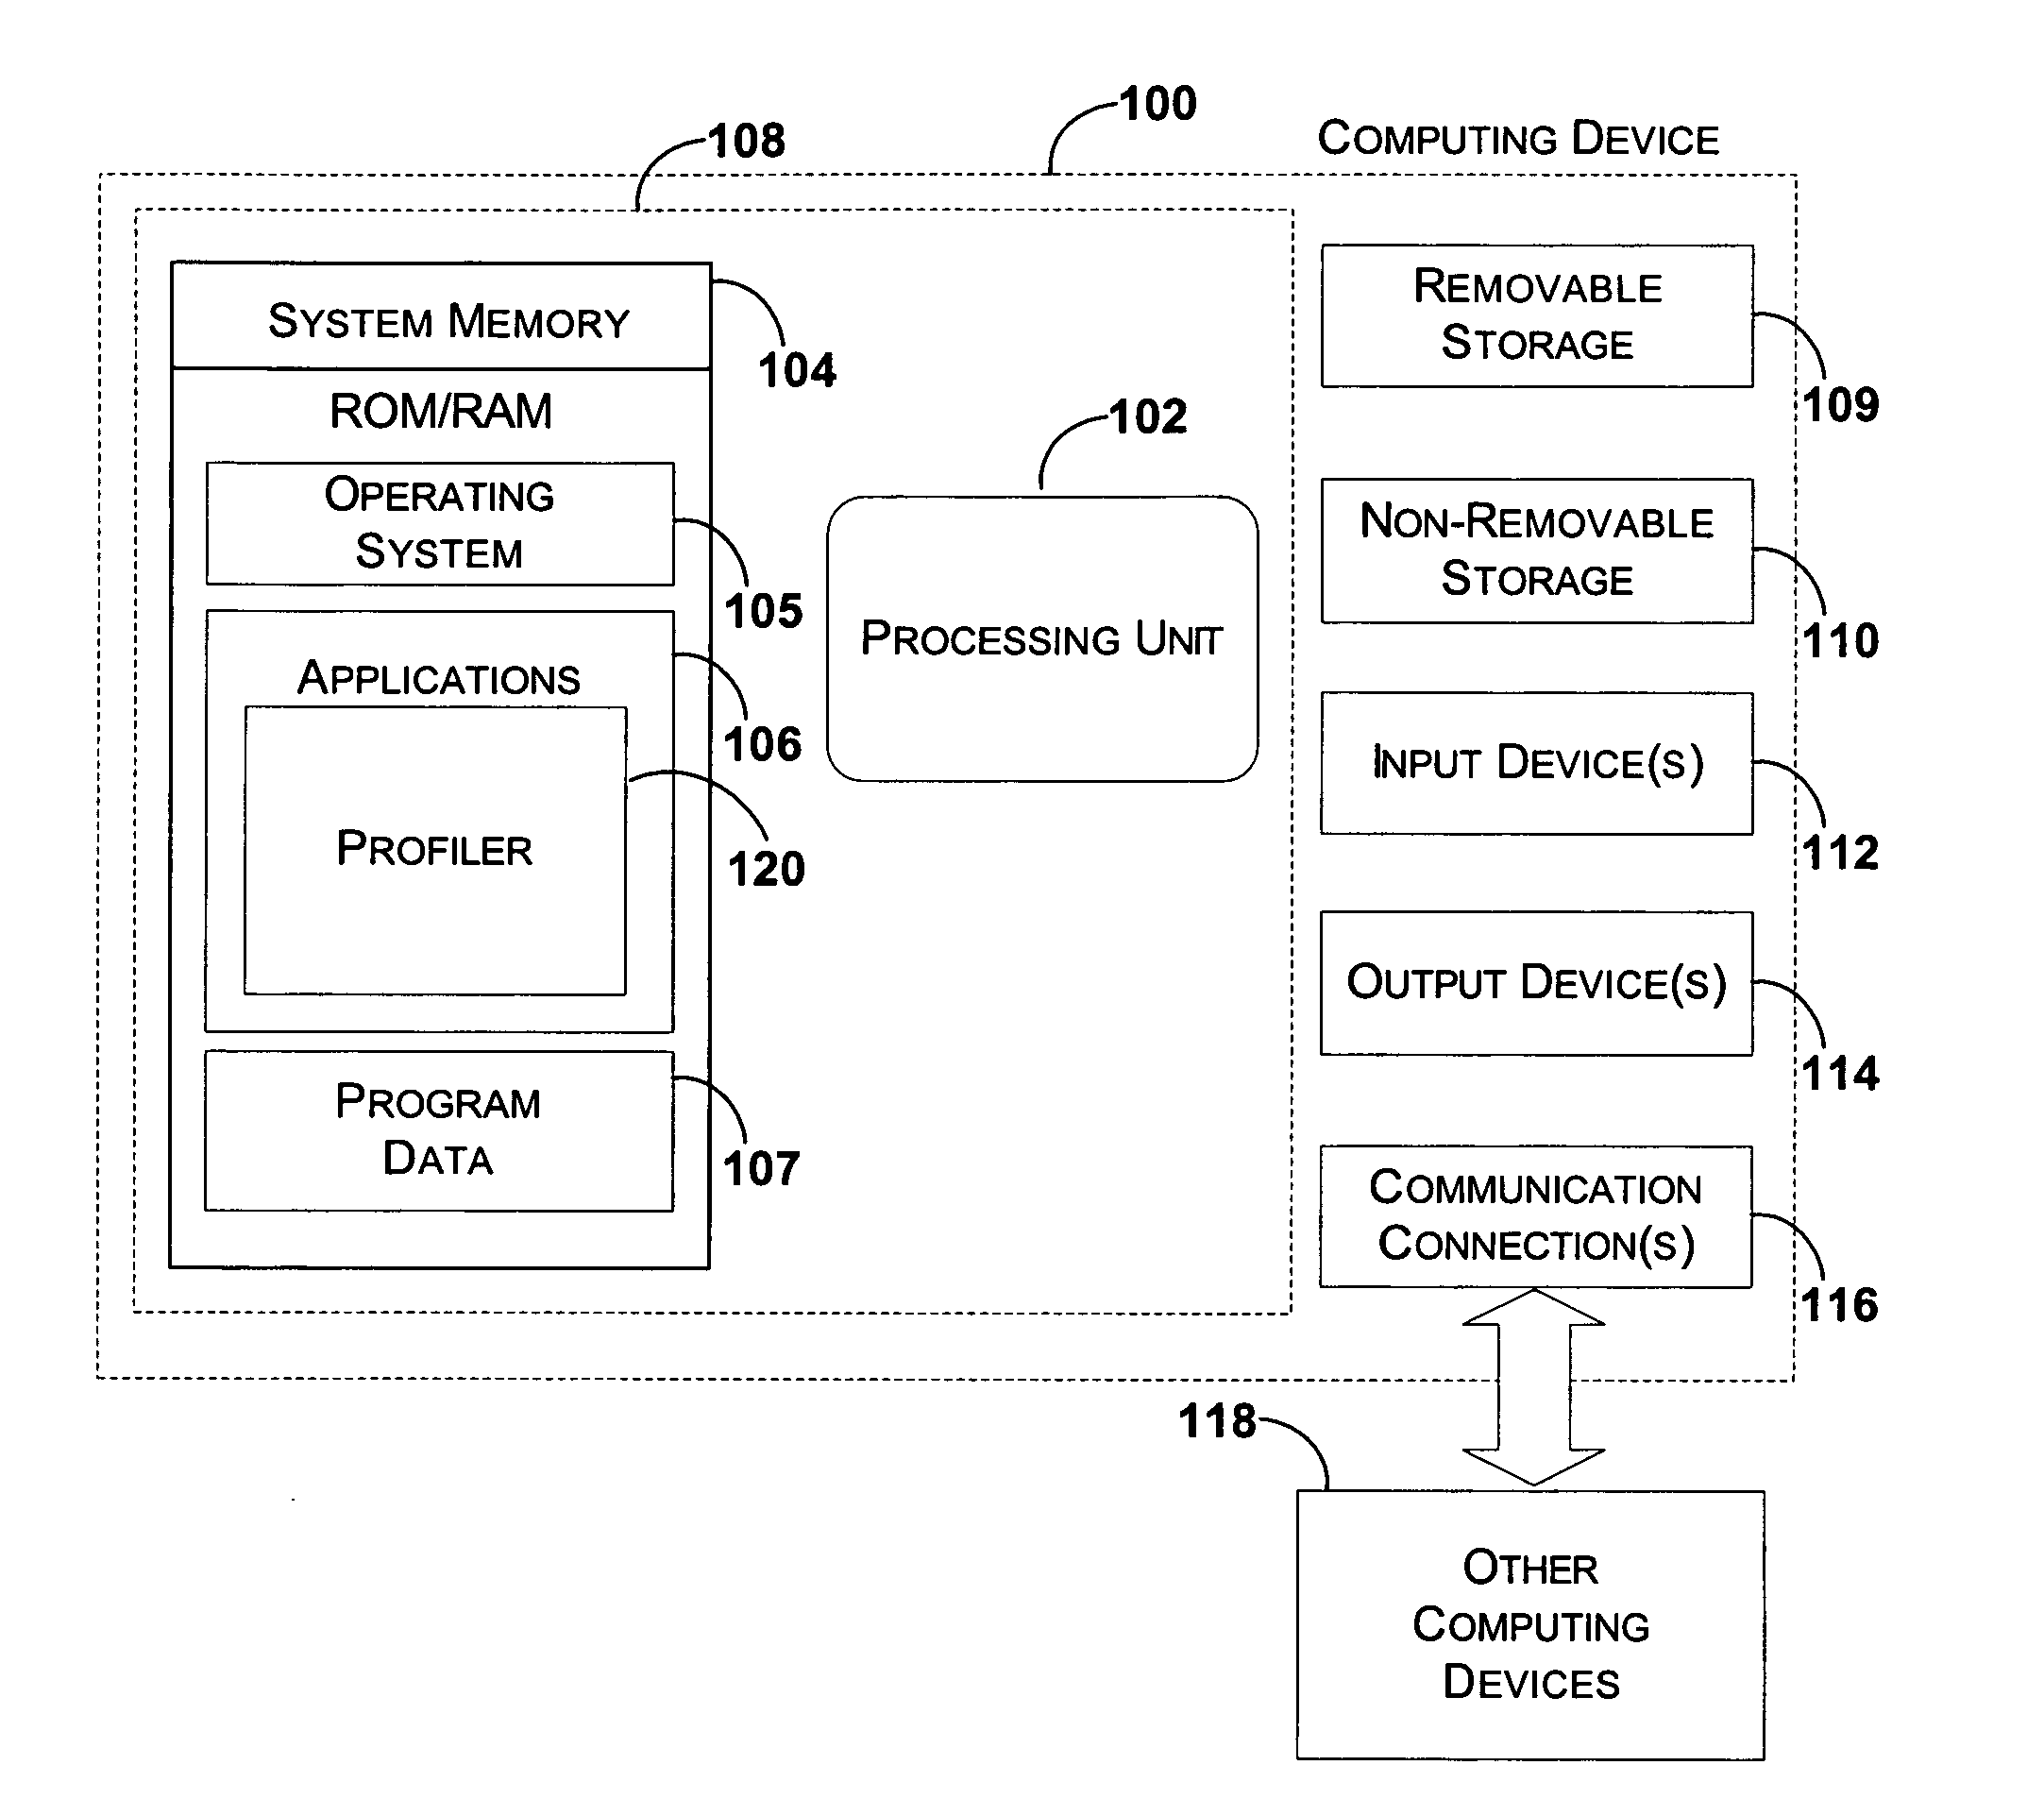
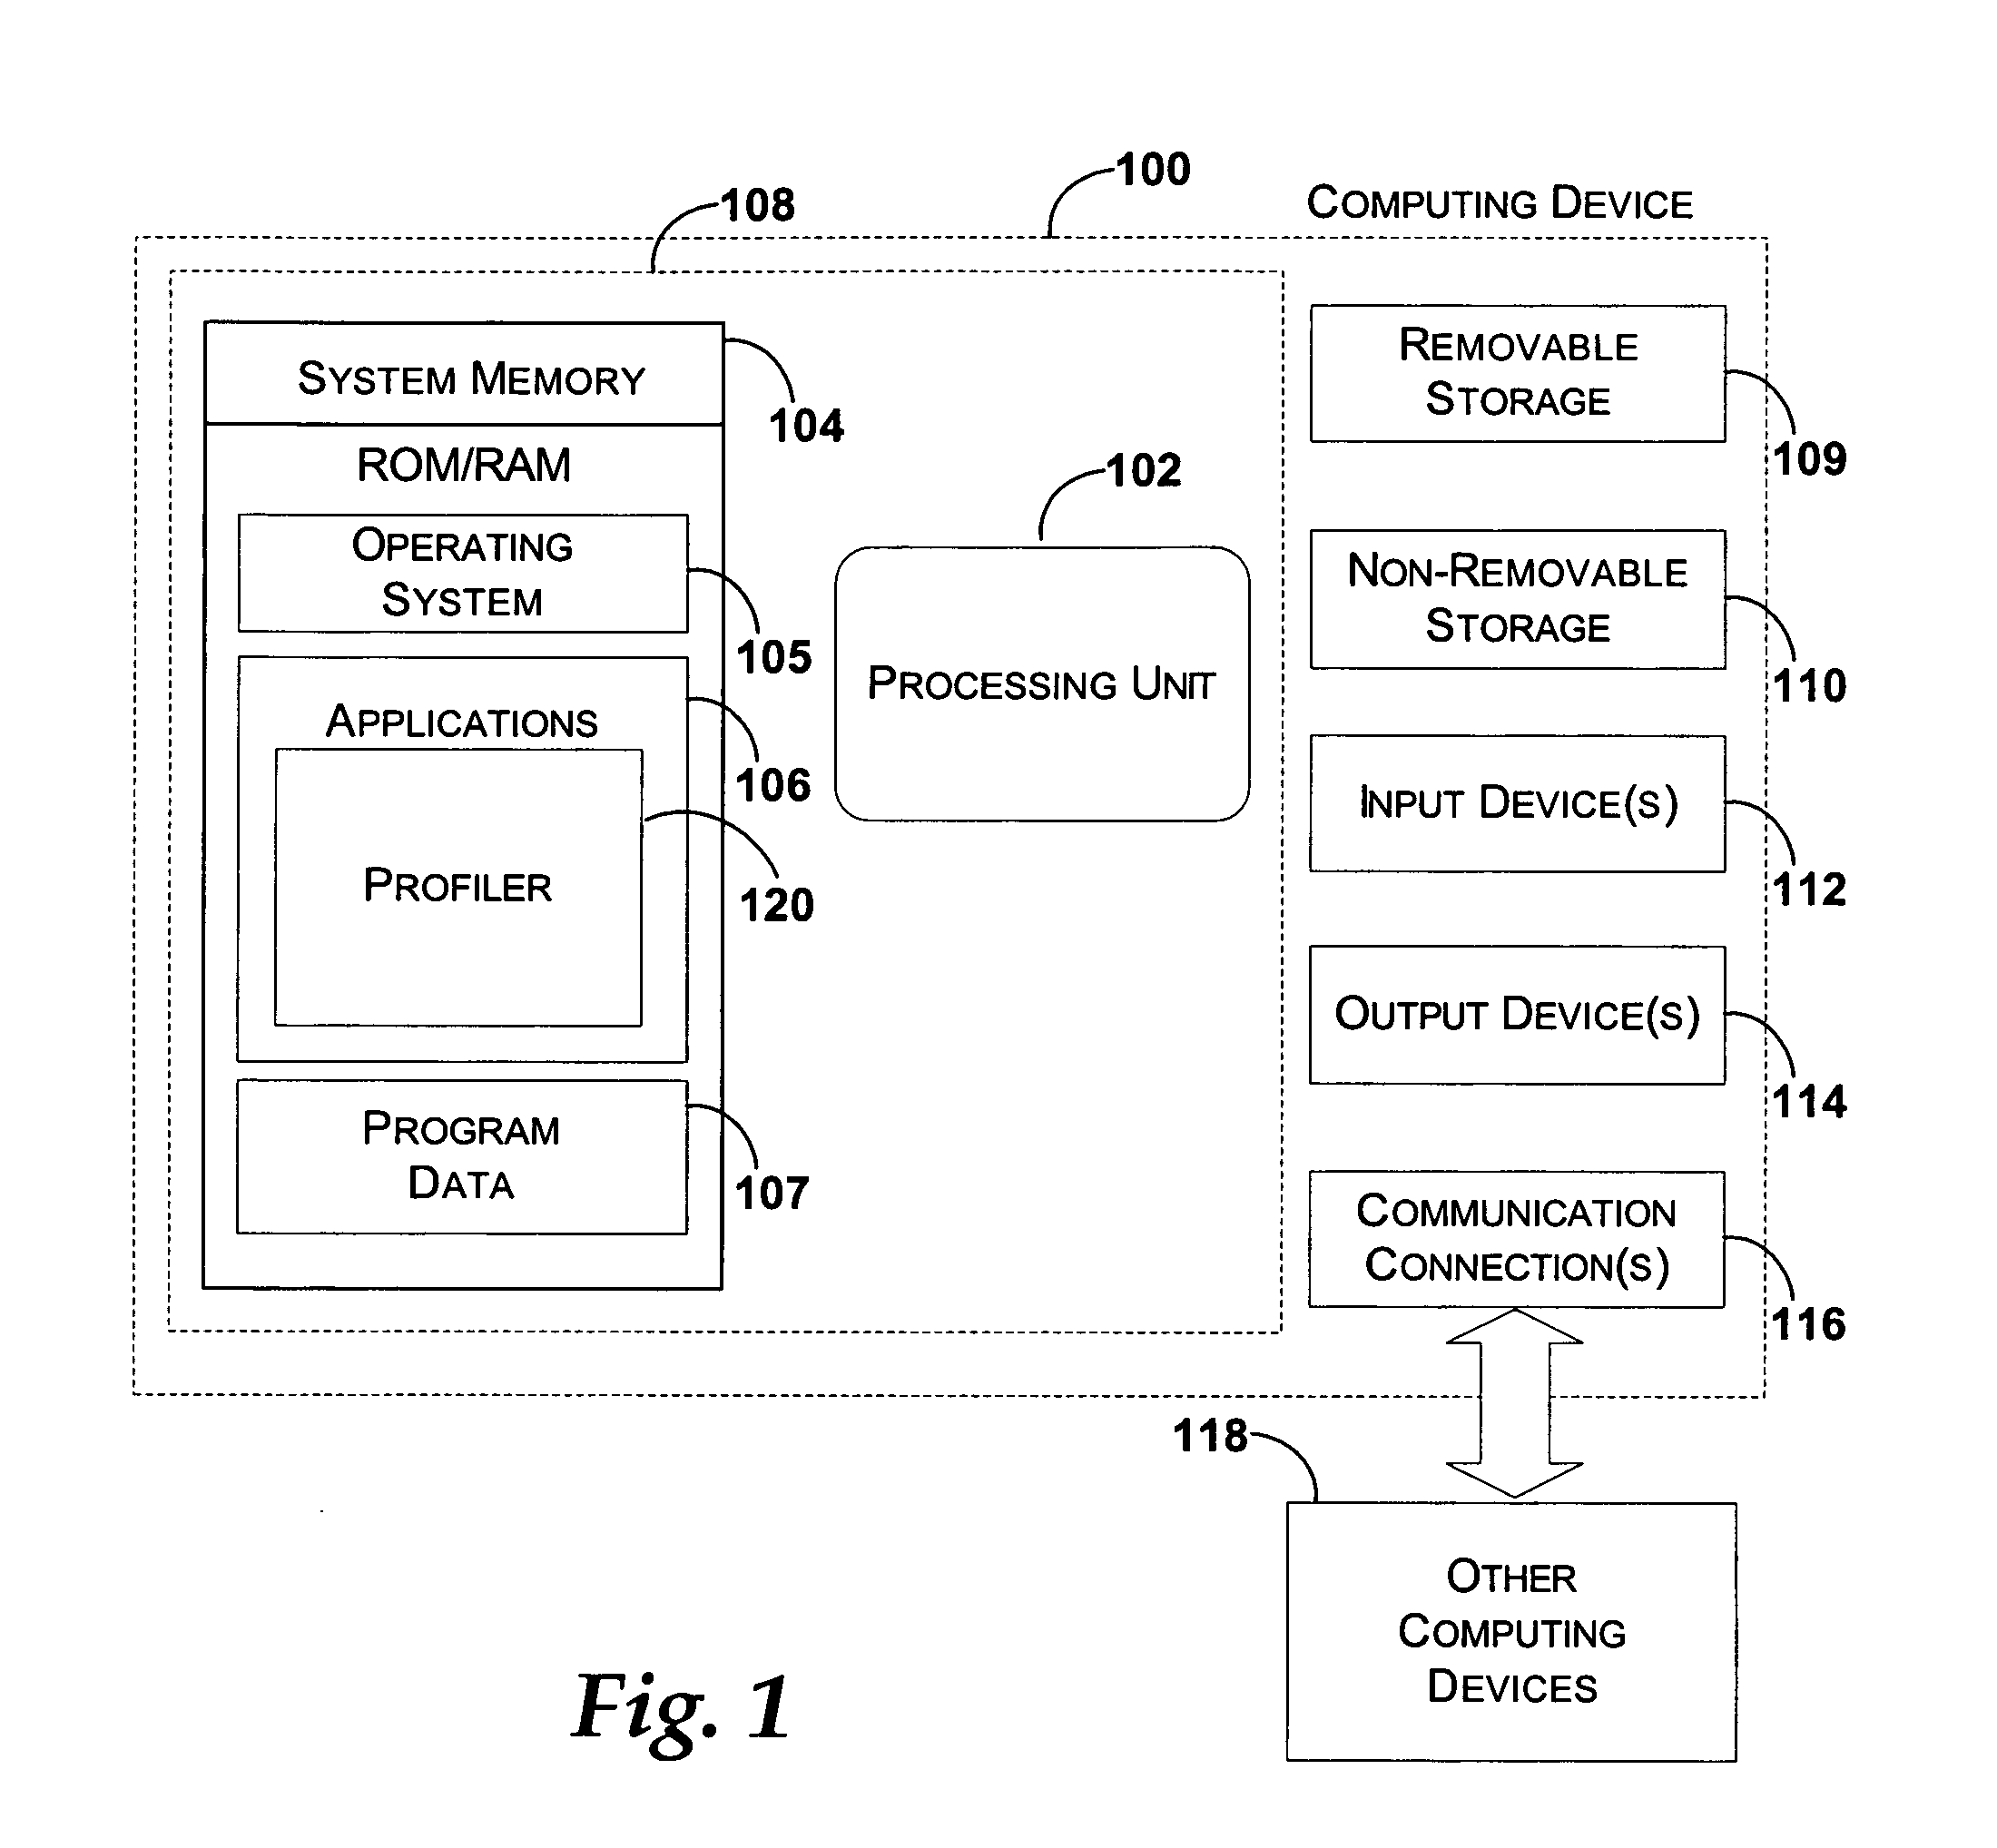
[0013] With reference to FIG. 1, one exemplary system for implementing the invention includes a computing device, such as computing device 100. In a very basic configuration, computing device 100 typically includes at least one processing unit 102 and system memory 104. Depending on the exact configuration and type of computing device, system memory 104 may be volatile (such as RAM), non-volatile (such as ROM, flash memory, etc.) or some combination of the two. System memory 104 typically includes an operating system 105, one or more applications 106, and may include program data 107. In one embodiment, applications 106 may include a profiler program 120. This basic configuration is illustrated in FIG. 1 by those components within dashed line 108.

[0014] Computing d...


PUM


Abstract

The present invention provides a method and system for capturing the call stack of a currently-running thread at the time a profiler interrupt occurs. The thread context of the thread is determined before a full push of the thread context is performed by the CPU architecture. The hardware state at the time of the interrupt is used to aid in determining which portions of memory to search for portions of the thread context. Based on the hardware state and the software state of the thread at the time of the interrupt the thread context is captured. Code may also be injected into a thread to capture a thread's call stack. The state of the thread is altered to induce the thread to invoke the kernel's call stack API itself, using its own context.

Description

BACKGROUND OF THE INVENTION [0001] Increasing the performance of a program can be a difficult task. One piece of information that helps programmers increase the performance of their programs is knowing where a program spends its time during execution. Knowing the execution times, a programmer may make changes to the program in order to make it run more efficiently. Another piece of information that is helpful is knowing the state of the program during various points of execution. [0002] A profiler is one tool that may be used to provide this execution information. Generally, a profiler is a separate program from the one being measured that determines, or estimates, which parts of a system are consuming the most resources while the program is executing. Some profiler tools measure the time at predetermined points within a program. For example, a profiler may determine how much time is spent within each function. In order to measure the resources being consumed, however, the program b...

Claims


Application Information

Patent Timeline
Patent Type & Authority Applications(United States)
IPC IPC(8): G06F9/46
CPCG06F9/4812G06F11/3476G06F11/3466
Inventor LOH, SUSAN A.HSIEH, BOR-MINGELDRIDGE, JOHN R.
Owner MICROSOFT TECH LICENSING LLC
Why Eureka
Try Eureka