Methods for measurement of magnetic resonance signal perturbations

a magnetic resonance signal and perturbation technology, applied in the field of magnetic resonance signal fluctuation measurement, can solve the problems of high temporal resolution, no non-invasive spatial resolution technology, direct measurement, etc., and achieve the effect of reducing the number of invasive measurements, and reducing the accuracy of invasive measurements

Inactive Publication Date: 2008-01-03
DECHARMS RICHARD CHRISTOPHER
View PDF90 Cites 176 Cited by
  • Summary
  • Abstract
  • Description
  • Claims
  • Application Information

AI Technical Summary

Problems solved by technology

To date, there is no non-invasive technology for spatially resolved, high temporal resolution, direct measurement of neuronal signals from within the brain.
It is also not straightforward to determine the exact relationship between observed hemodynamic activations and underlying neural function [Boynton, Engel et al.
Finally, reliance on hemodynamics may also create an inherent limit in spatial resolution governed by the vascular system.
MEG and EEG enable non-invasive measurement of neuronal currents with high temporal resolution, but more limited spatial capability.
For deeper-lying structures, localization is considerably more problematic.
Many psychological and neurological conditions arise because of inadequate levels of activity or inadequate control over discretely localized regions within the brain.
This may take place because the electromagnetic field causing the change is not perfectly homogeneous within the volume from which the measurement is made (for example an imaging voxel or spectroscopy voxel).
Since the electromagnetic field leads to a change in the homogeneity of the magnetic field, this can lead to susceptibility induced decreases in the signal intensity from the measured voxel.
A challenge in the measurements just described is that many electromagnetic fields of interest may be very small 240 (e.g. in the range of 10−15 to 10−6 Tesla depending upon the magnitude of the field) relative to the field strength of measurement (e.g. 0.1 to 10 Tesla).
In addition, a number of noise sources may produce changes in the phase, magnitude, orientation, or other characteristics of the MR signal.
One method for measuring a reference signal is to use a second receive coil which measures an MR signal from a reference location, this location being susceptible to some of the same ‘common mode’ noise sources as the source location, but differentially susceptible to the signal of interest.
Remaining, unpredictable variance at the source location will reflect uncorrelated noise, and independent signals.

Method used


Image

  • Methods for measurement of magnetic resonance signal perturbations
  • Methods for measurement of magnetic resonance signal perturbations
  • Methods for measurement of magnetic resonance signal perturbations

Examples


examples

Theoretical Basis and Previous Investigations of MR Phase Measurement

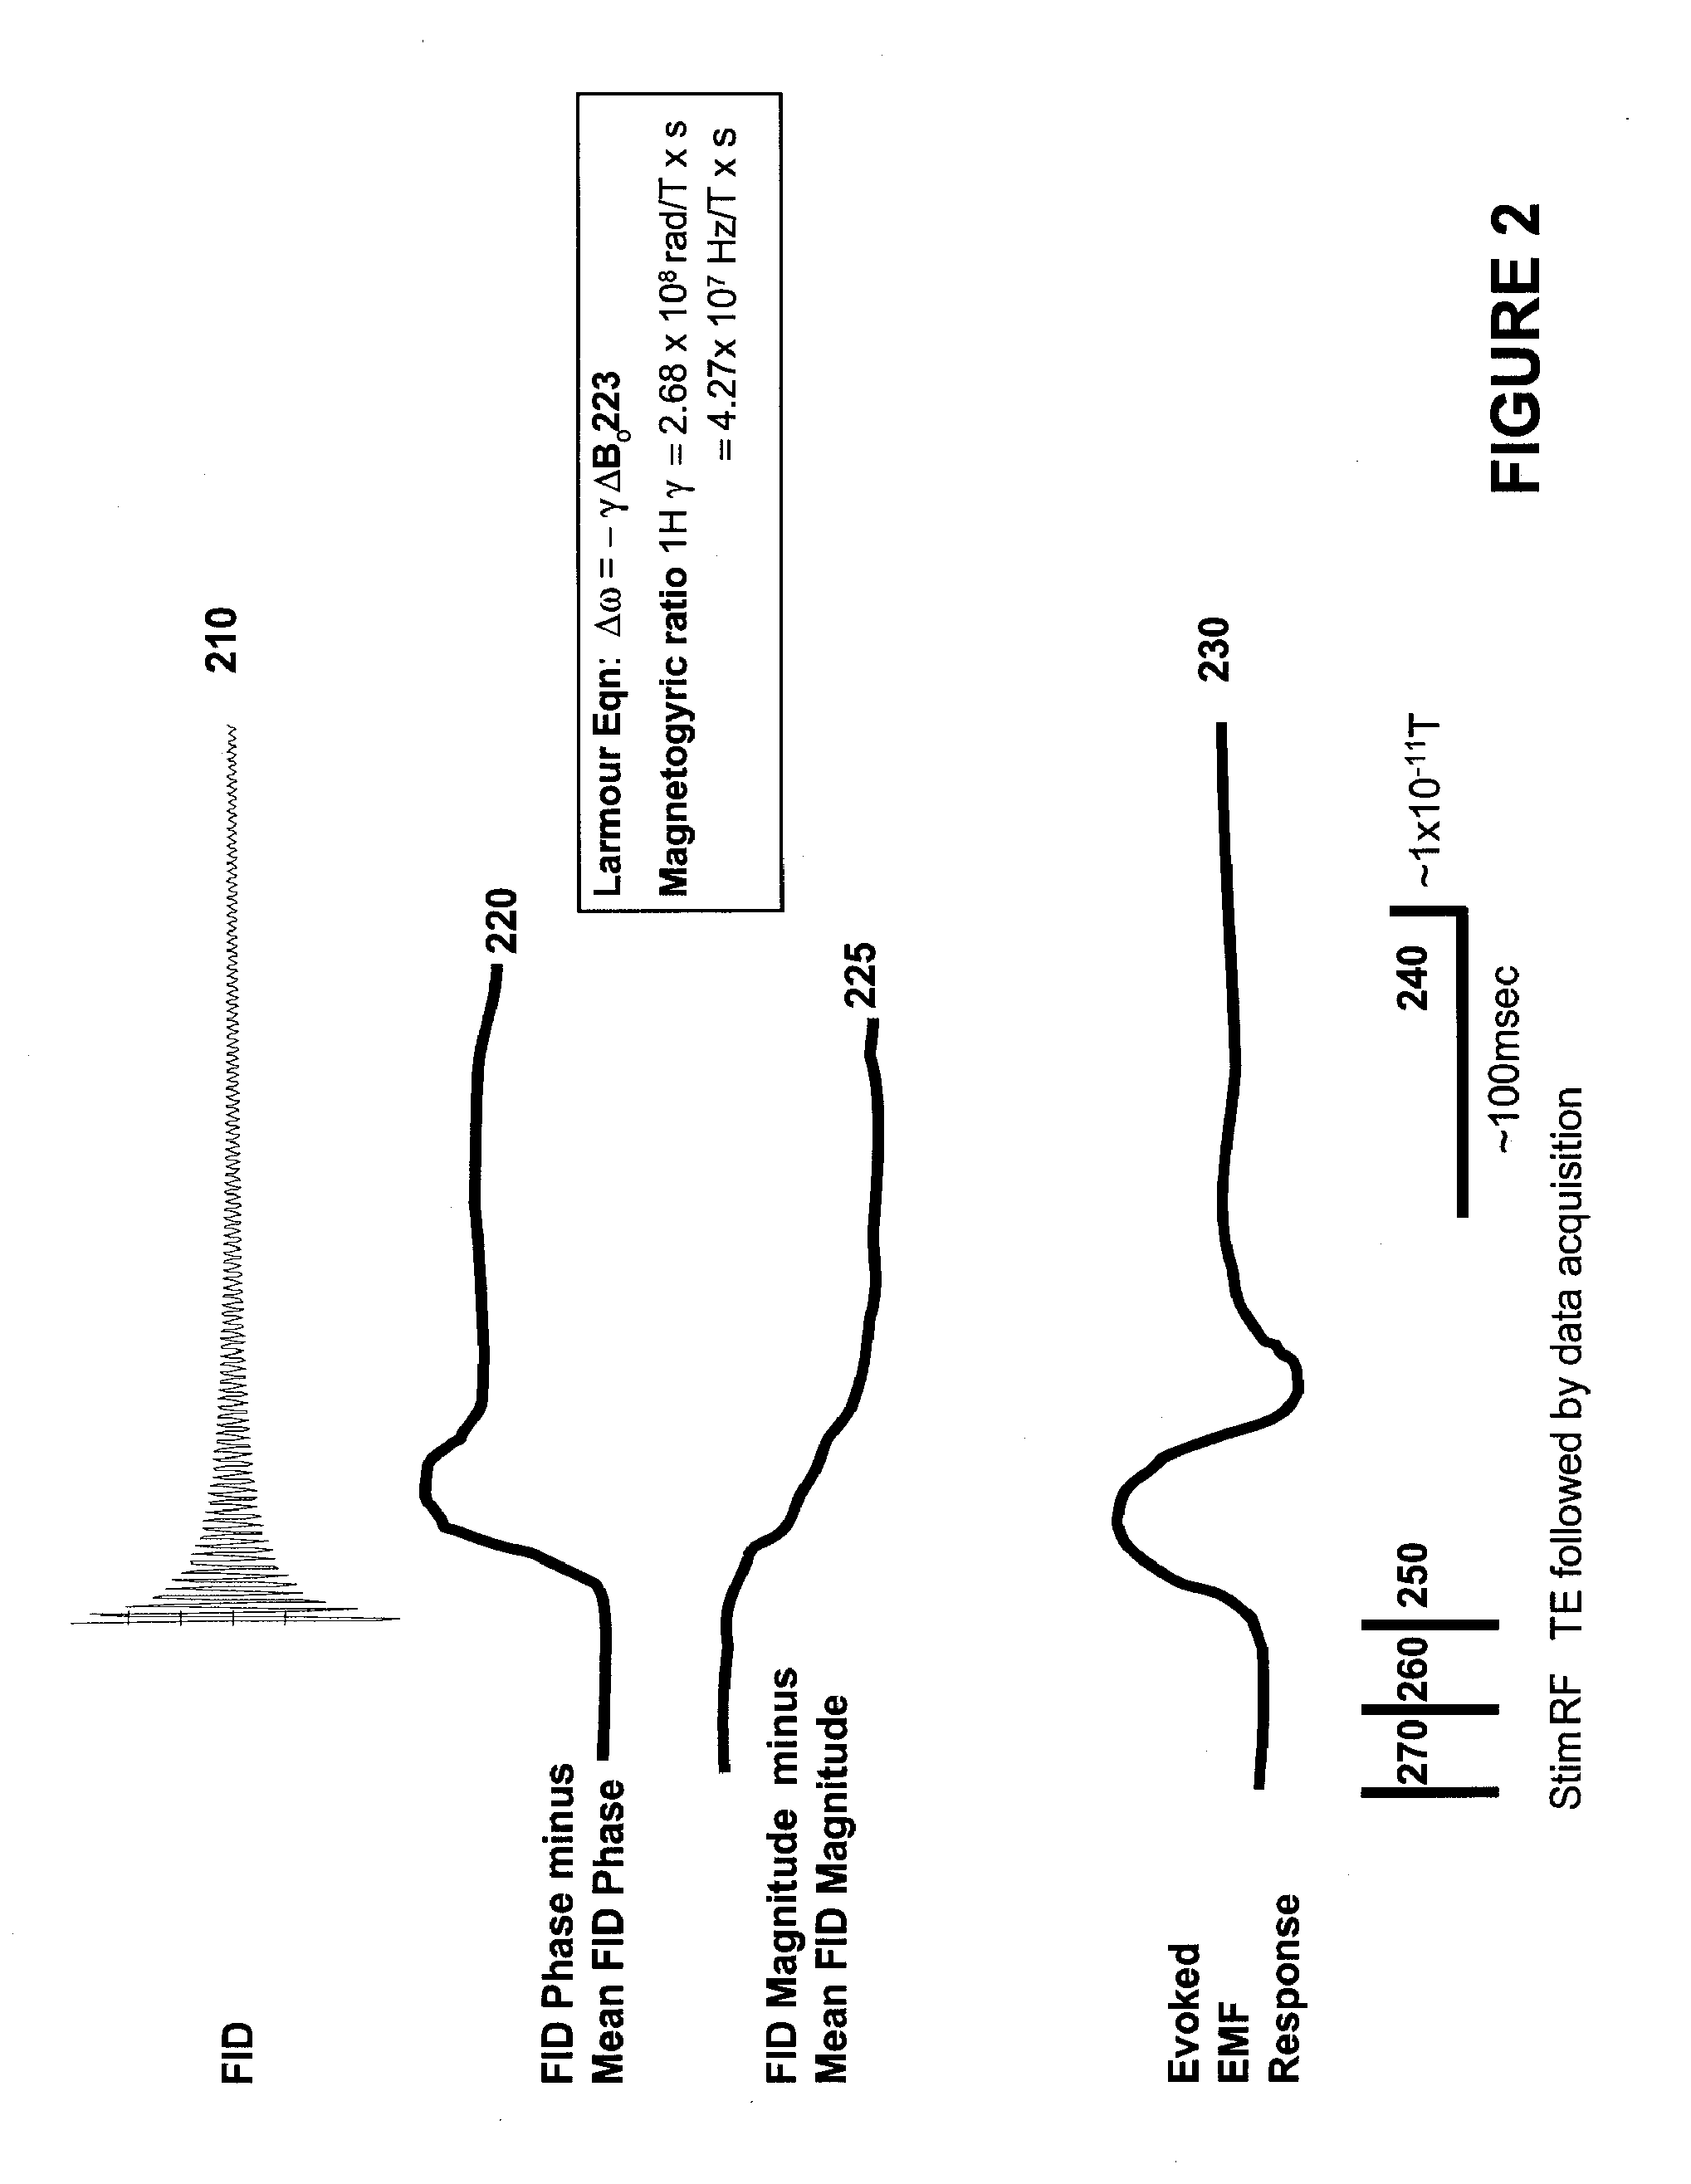
[0220] Precise measurements of B0 fluctuations using MR are explained by the relation that σφ+1 / SNR, where σφ is the MR phase noise in radians, and SNR is the signal to noise ratio of the MR magnitude signal. The phase value may be substituted into the Larmour equation (expressed in terms of phase): Δφ(r)=γBz(r)TE, where Δφ(r) is the change in phase at a point r resulting from a perturbation of the Bz, TE is the duration of phase accumulation prior to measurement, and γ is the magnetogyric ratio. At 1.5 T, an MR signal resonates over 6.4 million cycles during a 100 ms period. Since the MR phase signal represents a small fraction of one cycle, a modest phase precision of 1 / 100th of a cycle (0.06 radians) at 100 ms predicts a ΔB0 measurement precision of 1 part in 100×6.4 million, or 4×10⁻⁹ T. Therefore, MR phase measures B0 fluctuations with surprising precision. Nyquist sampling theory limits the frequency resolut...


PUM


Abstract

The present invention relates to methods, software and systems for monitoring fluctuations in magnetic resonance signals. These methods may be used for measurements of the human brain and nervous system, and may be used for measuring electric currents and electromagnetic fields internal to an object. This method may include the use of a reference signal to accomplish differential recording of electromagnetic fields from two or more spatial locations.

Description

CROSS-REFERENCE [0001] This application claims the benefit of U.S. Provisional Application, entitled “Methods For Physiological Monitoring—EmfMRI,” filed May 15, 2004 and U.S. Provisional Application No. 60 / 475,931, filed Jun. 3, 2003. [0002] This application is also related to the following co-pending patent applications: [0003] U.S. Ser. No. 10 / 628,875, filed Jul. 28, 2003, now U.S. Publication No. US-2004 / 0092809 A1, entitled “Methods for Measurement and Analysis of Brain Activity”, and U.S. Ser. No. 10 / 066,004, filed Jan. 30, 2002, now U.S. Publication No. US-2002 / 0103429 A1, entitled “Methods for Physiological Monitoring, Training, Exercise and Regulation”, each of which is incorporated herein by reference in its entirety.”SUMMARY OF THE INVENTION [0004] The present invention is directed to various methods relating to the measurement of fluctuations of magnetic resonance signals. These fluctuations may be used to measure fluctuations induced by electrical current and electromag...

Claims


Application Information

Patent Timeline
Patent Type & Authority Applications(United States)
IPC IPC(8): G01R33/54A61B5/05A61B5/055G01RG01R33/48
CPCA61B8/0808G01R33/4806
Inventor DECHARMS, RICHARD CHRISTOPHER
Owner DECHARMS RICHARD CHRISTOPHER
Why Eureka
Try Eureka