Optical Spectroscopy Instrument Response Correction

a technology of optical instruments and correction methods, applied in instruments, spectrometry/spectrophotometry/monochromators, optical radiation measurement, etc., can solve the problems of not having a straight line measured spectrum, not having perfect or ideal performance of optical instruments in real life,

Inactive Publication Date: 2008-02-14
CHEMIMAGE CORP
View PDF4 Cites 12 Cited by
  • Summary
  • Abstract
  • Description
  • Claims
  • Application Information

AI Technical Summary

Benefits of technology

[0014] In one embodiment, the present disclosure relates to correction of instrument response of an optical spectroscopy instrument using a Raman standard sample supplied by NIST. The smoother side of the NIST sample is placed facing a light collection optics in the spectroscopy instrument, whereas the non-smooth or rough side remains away from the light collection optics, but in contact with a platform or sample placement surface in the spectroscopy instrument. An instrument response function is determined with the NIST sample so placed. Thereafter, spectra or spectral images of target samples obtained using the spectroscopy instrument are divided by the instrument response function to correct for imperfections in the response of the optical spectroscopy instrument. When the smoother side of the NIST sample faces the light collection optics in the spectroscopy instrument, the field of view of the focal plane (of the spectroscopy instrument) is more homogeneous, allowing for a correction of spatial variations across the image field of view in the spectroscopy instrument. The target sample spectra may be non-Raman spectra. The optical spectroscopy instrument may be a gratings-based or a tunable filter based spectroscopic imaging system.

Problems solved by technology

An optical instrument in real life does not have a perfect or ideal performances for all wavelengths of light.
When this ideal source is used with an imperfect instrument, however, the measured spectrum is not a straight line.

Method used


Image

  • Optical Spectroscopy Instrument Response Correction
  • Optical Spectroscopy Instrument Response Correction
  • Optical Spectroscopy Instrument Response Correction

Examples


Embodiment Construction

[0024] The accompanying figure and the description that follows set forth the present disclosure in embodiments of the present disclosure. However, it is contemplated that persons generally familiar with optics, operation and maintenance of optical instruments (including spectroscopic instruments), or optical spectroscopy will be able to apply the teachings of the present disclosure in other contexts by modification of certain details. Accordingly, the figures and description are not to be taken as restrictive of the scope of the present disclosure, but are to be understood as broad and general teachings. In the discussion herein, when any numerical range of values is referred, such range is understood to include each and every member and / or fraction between the stated range of minimum and maximum.

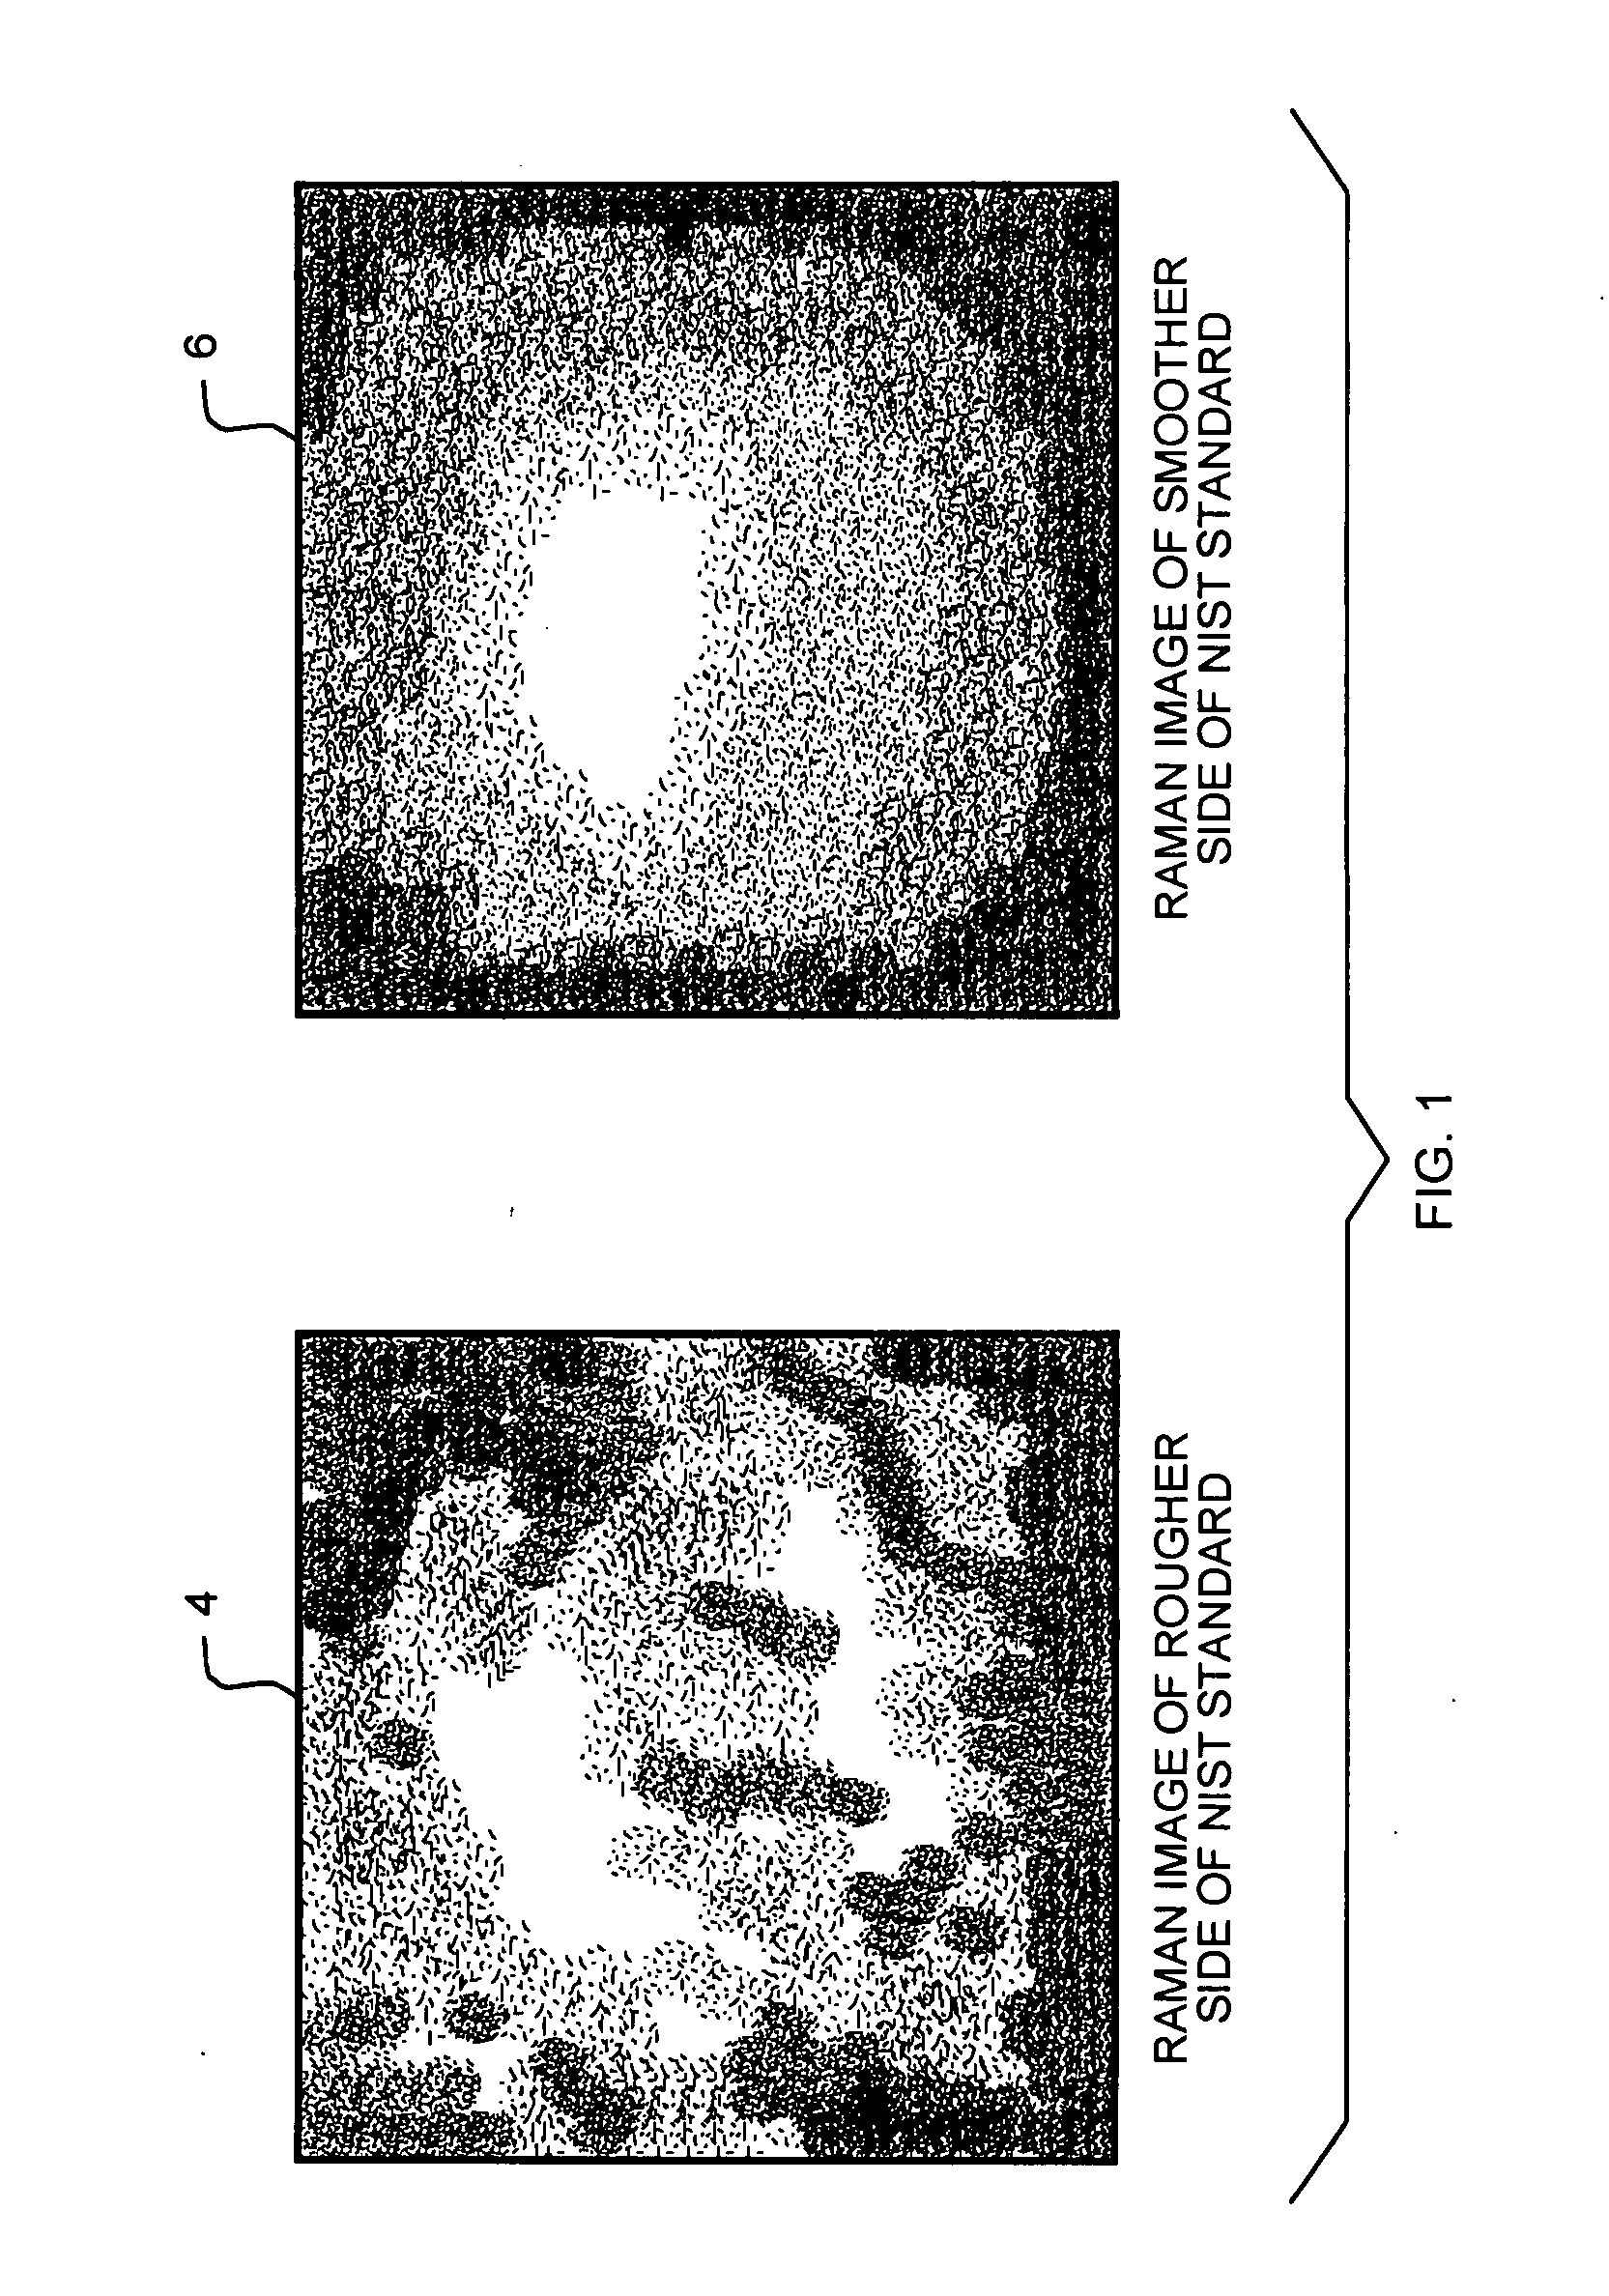
[0025]FIG. 1 shows exemplary Raman images of rough ad smoothed sides of a NIST standard sample (SRM 2242). In FIG. 1, the image of the rougher side is identified by reference numeral “4” ...


PUM

PropertyMeasurementUnit
illumination wavelengthaaaaaaaaaa
wavelengthsaaaaaaaaaa

Abstract

A system and method for correction of instrument response of an optical spectroscopy instrument using a Raman standard sample supplied by NIST (National Institute of Standards and Technology). The smoother side of the NIST sample is placed facing a light collection optics in the spectroscopy instrument, whereas the non-smooth or rough side remains away from the light collection optics, but in contact with a platform or sample placement surface in the spectroscopy instrument. An instrument response function is determined with the NIST sample so placed. Thereafter, spectra or spectral images of target samples obtained using the spectroscopy instrument are divided by the instrument response function to correct for imperfections in the response of the optical spectroscopy instrument. The target sample spectra may be non-Raman spectra. The optical spectroscopy instrument may be a gratings-based or a tunable filter based chemical imaging system.

Description

REFERENCE TO RELATED APPLICATION [0001] The disclosure in the present application claims priority benefit under 35 U.S.C. § 119(e) of the U.S. Provisional Application No. 60 / 834,721, titled “Instrument Response Correction,” and filed on Jul. 31, 2006.BACKGROUND [0002] 1. Field of the Disclosure [0003] The present disclosure generally relates to the field of optical instrument calibration and, more particularly, to a system and method for correction of instrument response of an optical instrument (e.g., a spectroscopic instrument) using a Raman standard from National Institute of Standards and Technology (NIST). [0004] 2. Brief Description of Related Art [0005] An optical instrument in real life does not have a perfect or ideal performances for all wavelengths of light. This is true at an optical component level or at an optical system level. A real-life, imperfect optical component or system can be evaluated in terms of its transmission or detection performance, for instance. Furthe...

Claims


Application Information

Patent Timeline
Patent Type & Authority Applications(United States)
IPC IPC(8): G12B13/00G01N1/00
CPCG01J3/02G01J3/0297G01N21/65G01N21/276G01J3/44
Inventor MAIER, JOHN
Owner CHEMIMAGE CORP
Why Eureka
Try Eureka