Anti-IgE Vaccines
a vaccine and ige technology, applied in the field of ige polypeptides, can solve the problems of low efficacy and questioned hyposensitization therapy, and achieve the effect of reducing the ige antibody effect and high antibody respons
- Summary
- Abstract
- Description
- Claims
- Application Information
AI Technical Summary
Benefits of technology
Problems solved by technology
Method used
Image
Examples
example 1
Materials and Methods
[0062]Dose escalation study to evaluate the safety and tolerability of anti-IgE immunotherapy: Thirty-two healthy human subjects were randomized into four dose groups of eight people each, with six subjects receiving a composition containing the active OSO drug product and two receiving placebo (saline). In addition to OSO, the composition contained ALHYDROGEL™ 1.3% (Brenntag Biosector, Frederikssund, Denmark), with one dose corresponding to 0.8 mg aluminum. Subjects received doses of 10 μg, 30 μg, 100 μg, or 300 μg OSO, independent of body weight. The four different dose levels were given in a semi-parallel sequential manner, so that the first injection of the consecutive dose level was given when the effect of the preceding dose level had been followed for 3 weeks and evaluated for safety and tolerability. Subjects were immunized at weeks 0, 3, and 5 with 10 μg, 30 μg, 100 μg, or 300 μg of OSO (the same dose was administered in all three immunizations). Serum ...
example 2
IgG anti-OSO ELISA
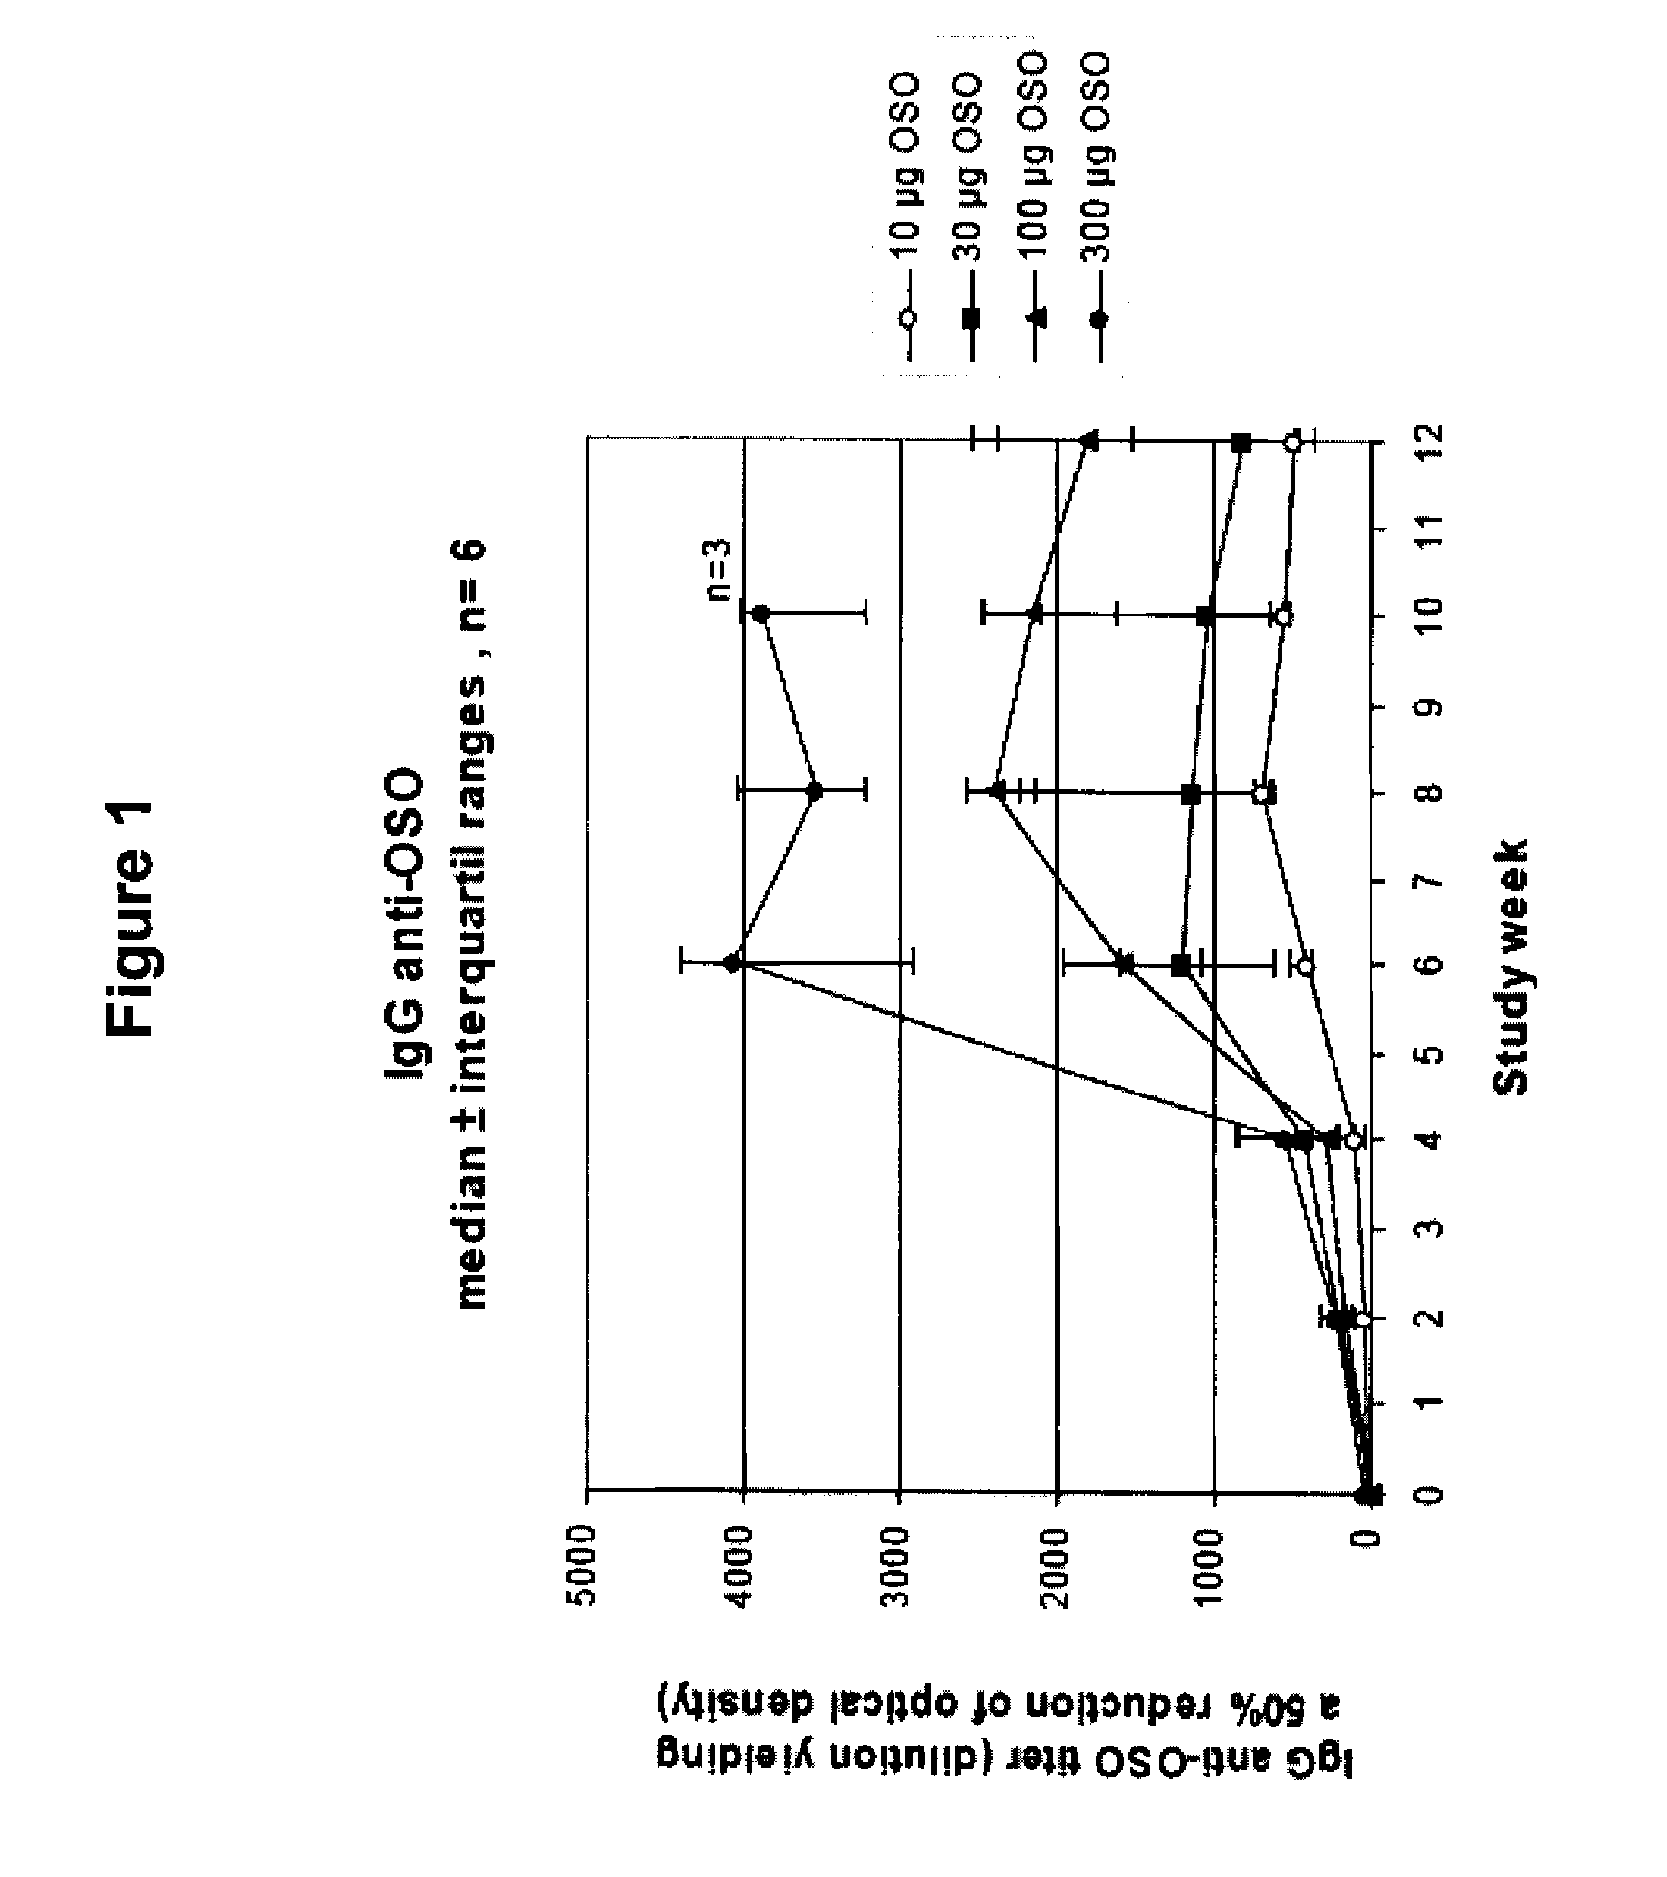
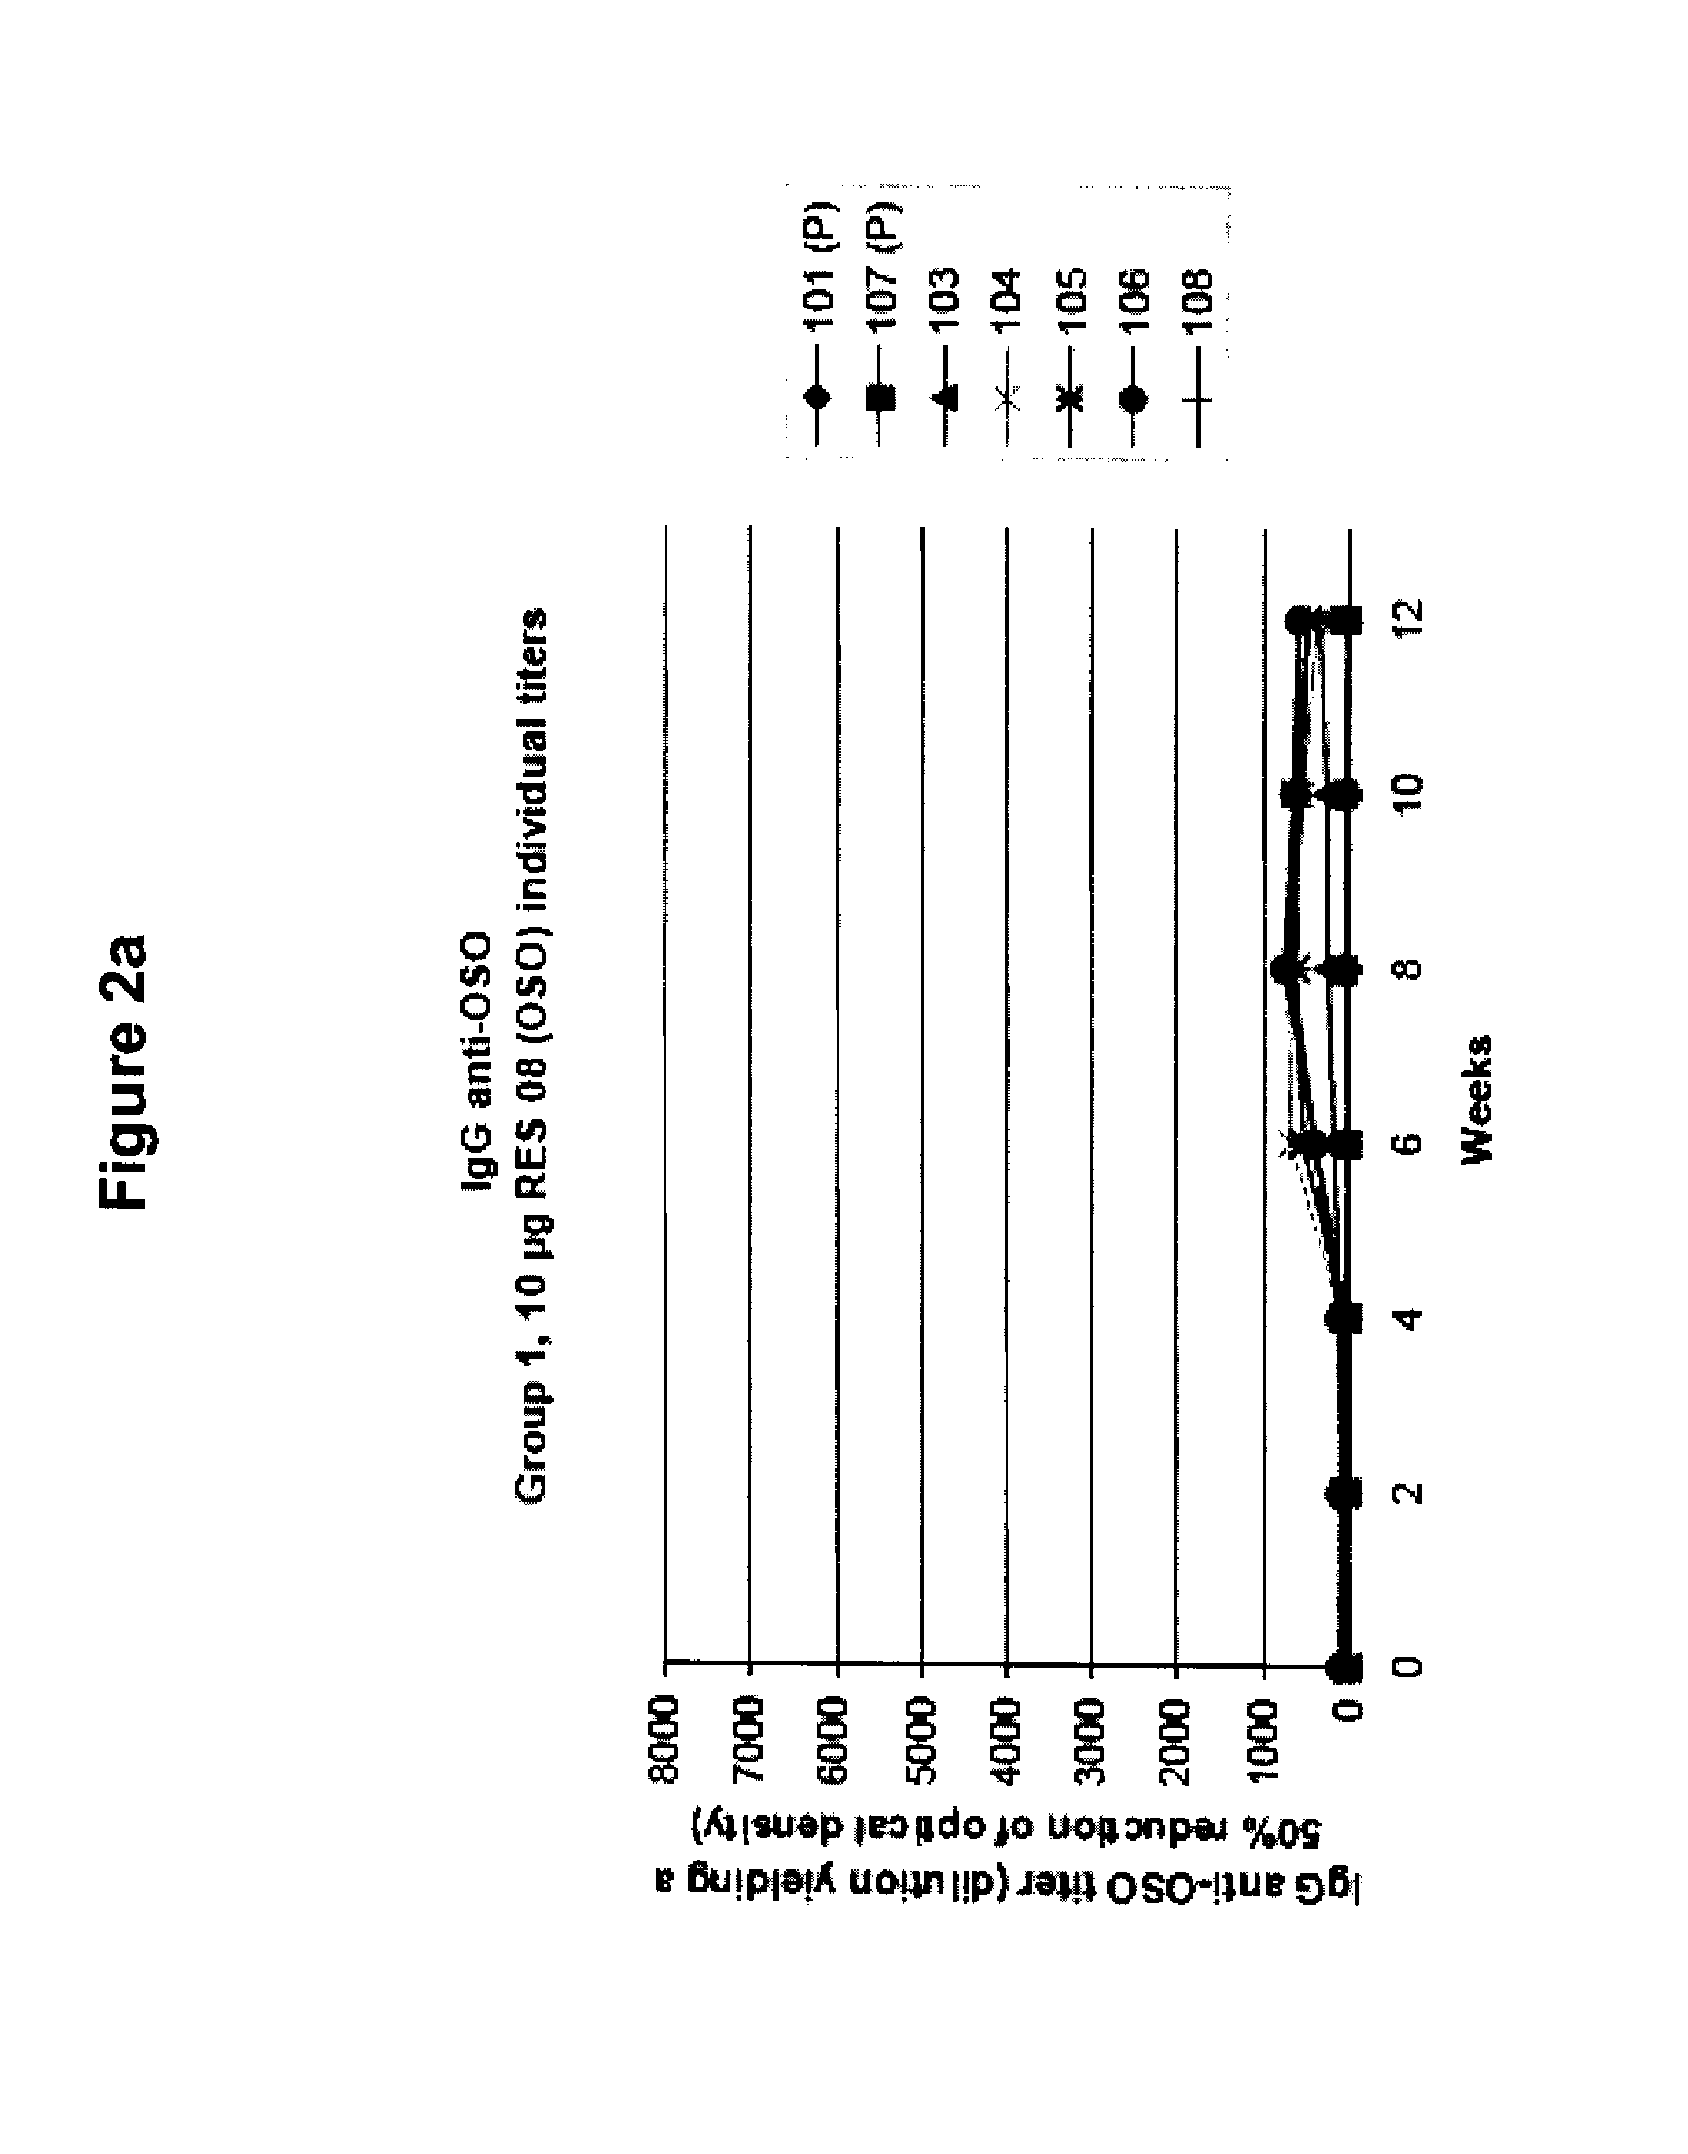
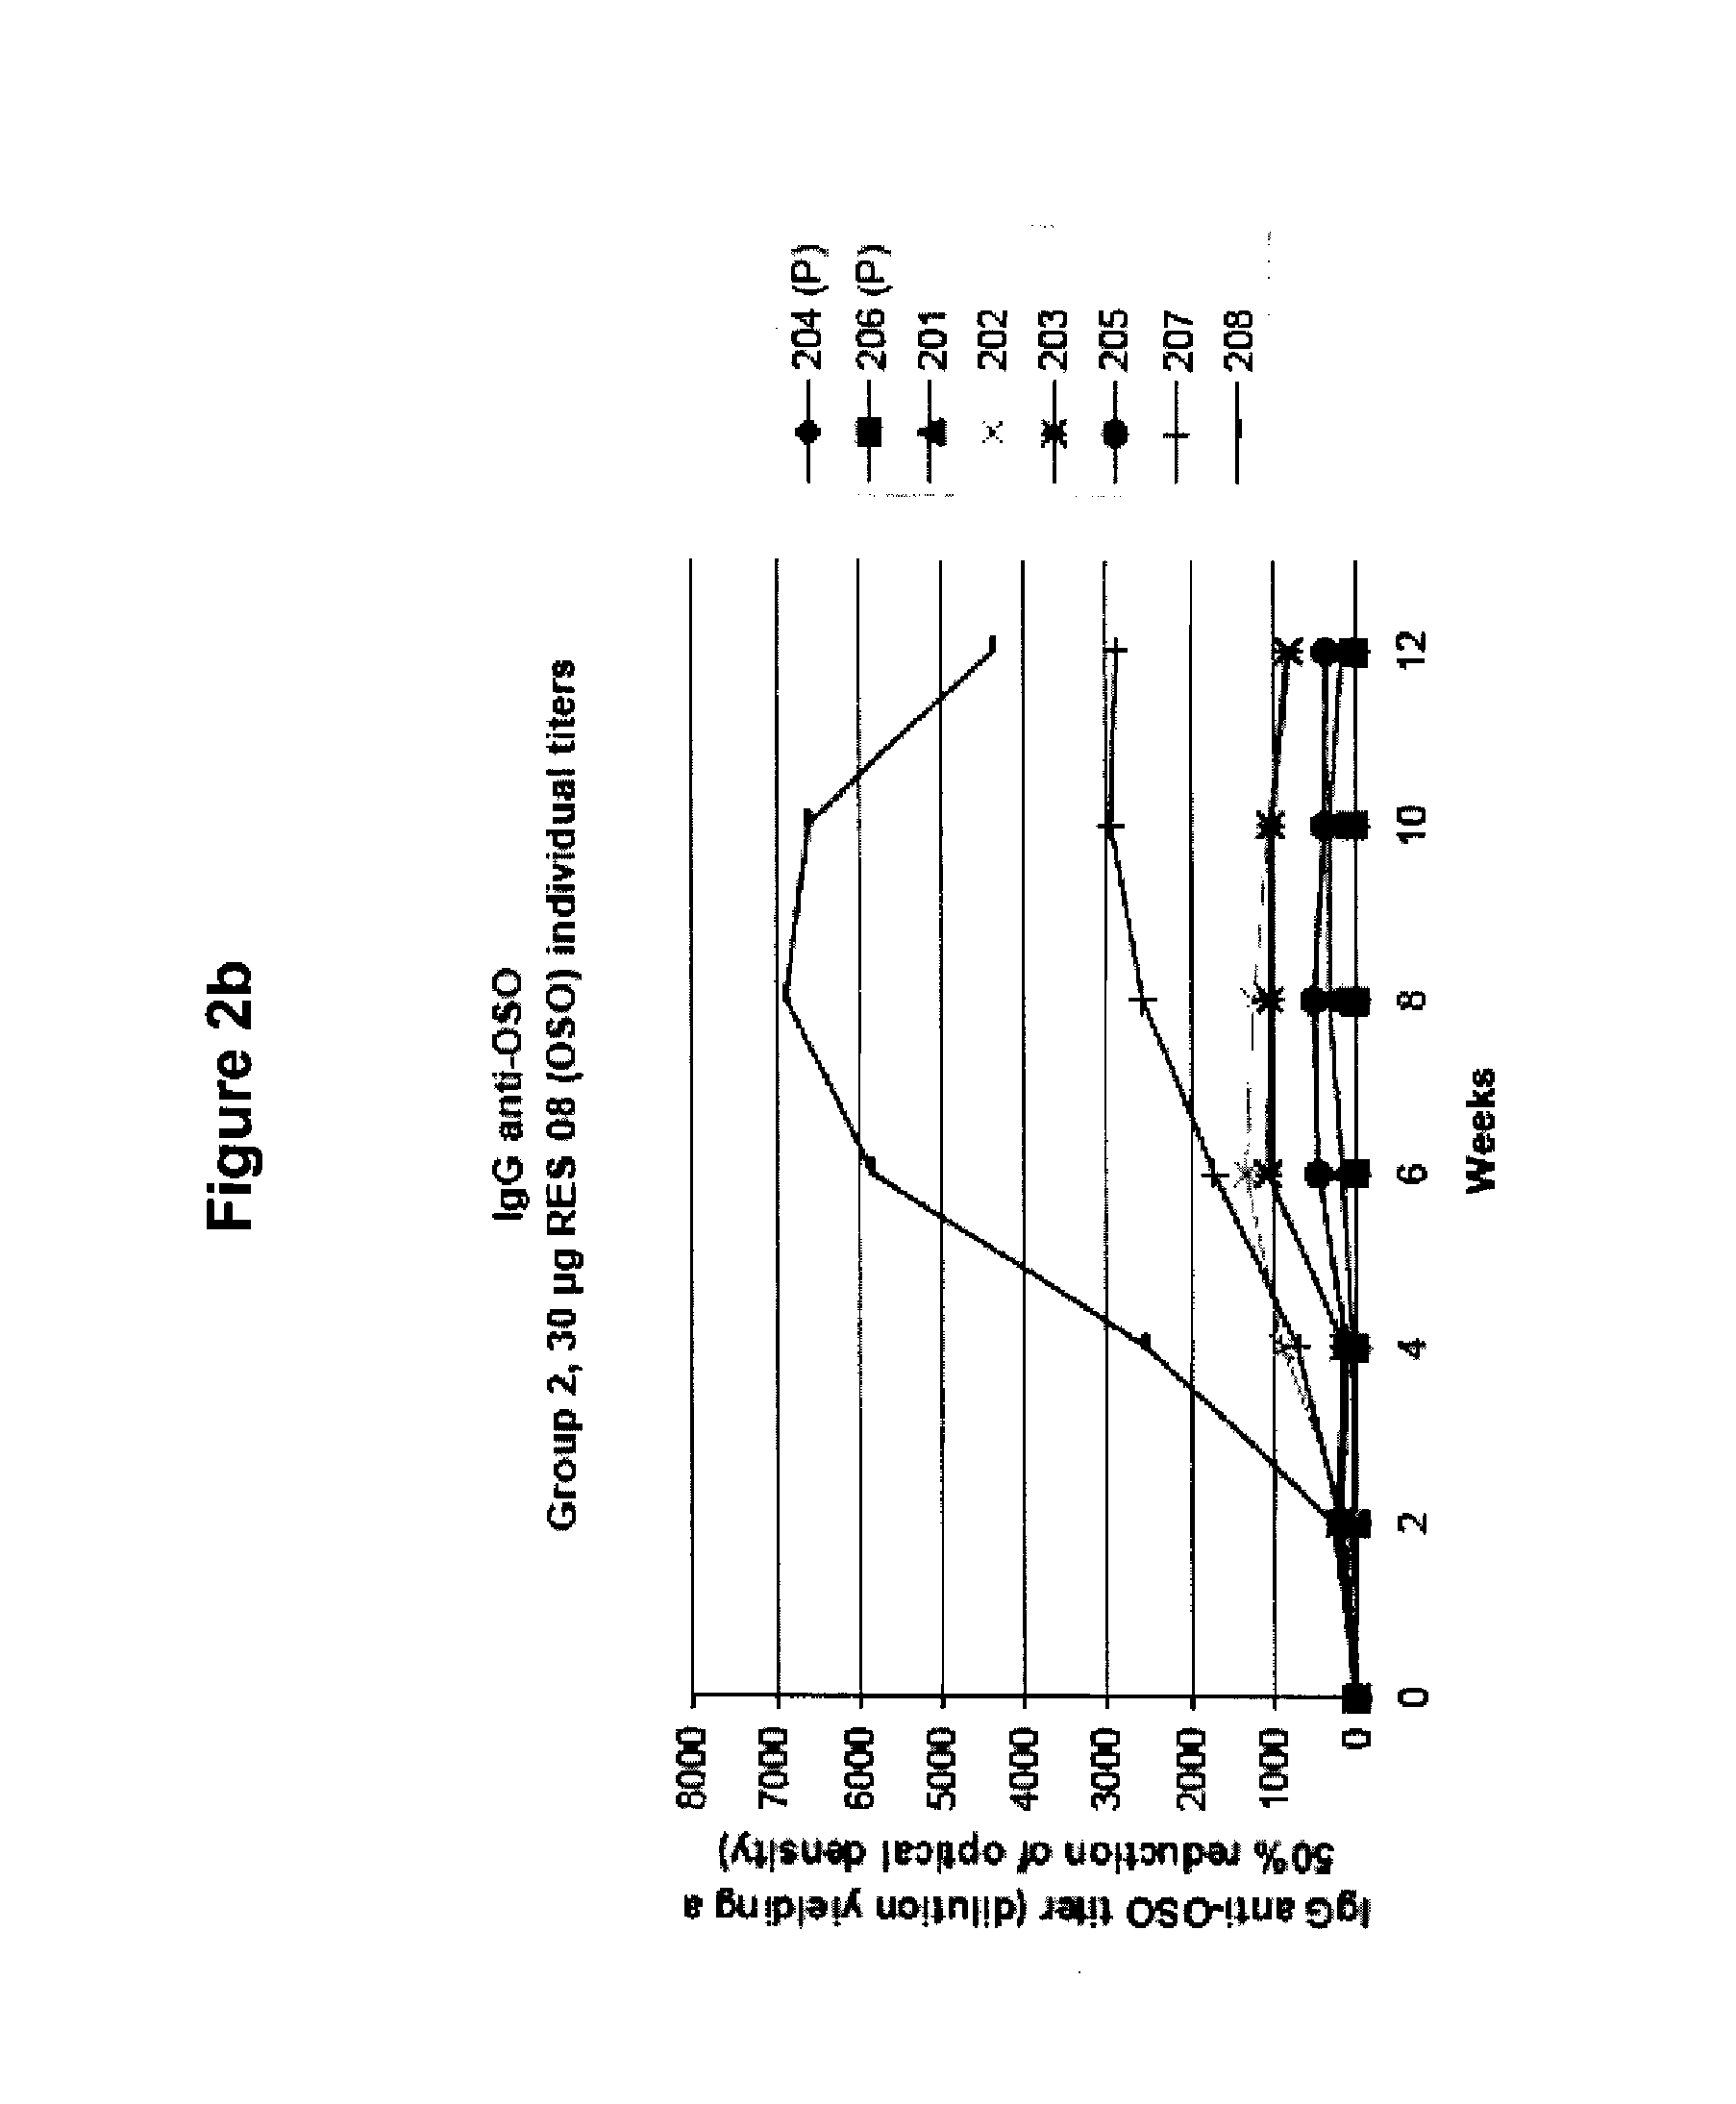
[0088]OSO was administered to human subjects as described in Example 1, and serum levels of IgG anti-OSO were measured by ELISA. FIG. 1 shows the group-wise IgG anti-OSO titers. A dose related increase of titers can be seen over time. The IgG anti-OSO response peaked at weeks 6-8, followed by a slight decline of the plateaus. FIGS. 2a-2d shows individual titer values of the different dose groups. The IgG anti-OSO response were found to be relatively homogenous within each group with the exception of subjects 208 (FIG. 2b) and subjects 401 and 407 (FIG. 2d). Neither serum samples at week 0 nor the placebo-treated individuals showed any response or cross reacting activity against OSO.
example 3
IgG anti-IgE ELISA
[0089]IgG anti-IgE was measured by ELISA as described in Example 1 and absorbance values (λ490 nm) at dilution 1:90 of the sera were plotted. FIGS. 3a-3d depict the individual IgG anti-IgE results of the different dose groups. In general, a considerable variation of the response was observed among the individuals and dose groups. An absorbance above background (plate blank) was evident in all individuals pre-dose (week 0). In most individuals the absorbance was slightly above the background but in some subjects a clear signal was seen, suggesting the presence of IgG auto antibodies against IgE (Boluda et al, 1995, Clin. Exp. Immunol., 100:145-50; Lichtenstein et al., 1992, J. Immunol., 148:3929-3936; Ritter et al., 1991, J. Allergy Clin. Immunol., 88:793-801; and Twena et al, 1989, Clin. Immunol. Immunopathol., 53:40-51). In dose group 1 (FIG. 3a), the presence of auto antibodies against IgE was clearly observed in subjects 103 and 105, who had high absorbance valu...
PUM
| Property | Measurement | Unit |
|---|---|---|
| pH | aaaaa | aaaaa |
| refractive index | aaaaa | aaaaa |
| refractive index | aaaaa | aaaaa |
Abstract
Description
Claims
Application Information
 - R&D
- Intellectual Property
- Life Sciences
- Materials
- Tech Scout
- Unparalleled Data Quality
- Higher Quality Content
- 60% Fewer Hallucinations
Browse by: Latest US Patents, China's latest patents, Technical Efficacy Thesaurus, Application Domain, Technology Topic, Popular Technical Reports.
© 2025 PatSnap. All rights reserved.Legal|Privacy policy|Modern Slavery Act Transparency Statement|Sitemap|About US| Contact US: help@patsnap.com


