
Slope Detection for Measuring Gas Concentration

Active Publication Date: 2008-05-22
GALVANIC APPLIED SCI
View PDF13 Cites 4 Cited by
  • Summary
  • Abstract
  • Description
  • Claims
  • Application Information

AI Technical Summary

Benefits of technology

[0033]The provisions for filtering may include provisions for low pass filtering the succession of sample values.
[0034]The provisions for low pass filtering may

Problems solved by technology

Errors in measurements taken by H2S tape analyzers result from various sources including the lead-acetate impregnated tape, the constituents in the gas stream itself, the aperture size through which the gas enters the reaction chamber, temperature of the reaction chamber and sampling rate.
Apart from temperature, it is not practical to pre-determine the properties of the tape.
Contaminants such as methyl mercaptan can cause side reactions that can affect the ability of hydrogen sulfide to react with the lead acetate.
When measuring high concentrations of H2S, a low sample rate may not provide sufficient granularity in measurements for an accurate concentration value to be calculated.
When measuring low concentrations with a high sample rate an excessive number of samples may be taken.
Measurements taken by this procedure are highly influenced by the effects described above and thus are neither sufficiently linear nor sufficiently repeatable for accurate, reliable measurements.
Consequently, many H2S Tape Analyzer manufacturers advertise the error of measurement produced by their devices to be “Error on Full Scale” and limit the dynamic range of their analyzers.
However, in practice measurements are only marginally better because the maximum dV / dt does not always occur at the same voltage.
Thus, the analysis is non-linear and this limits the dynamic range of the technique.

Method used


Image

  • Slope Detection for Measuring Gas Concentration
  • Slope Detection for Measuring Gas Concentration
  • Slope Detection for Measuring Gas Concentration

Examples


Embodiment Construction

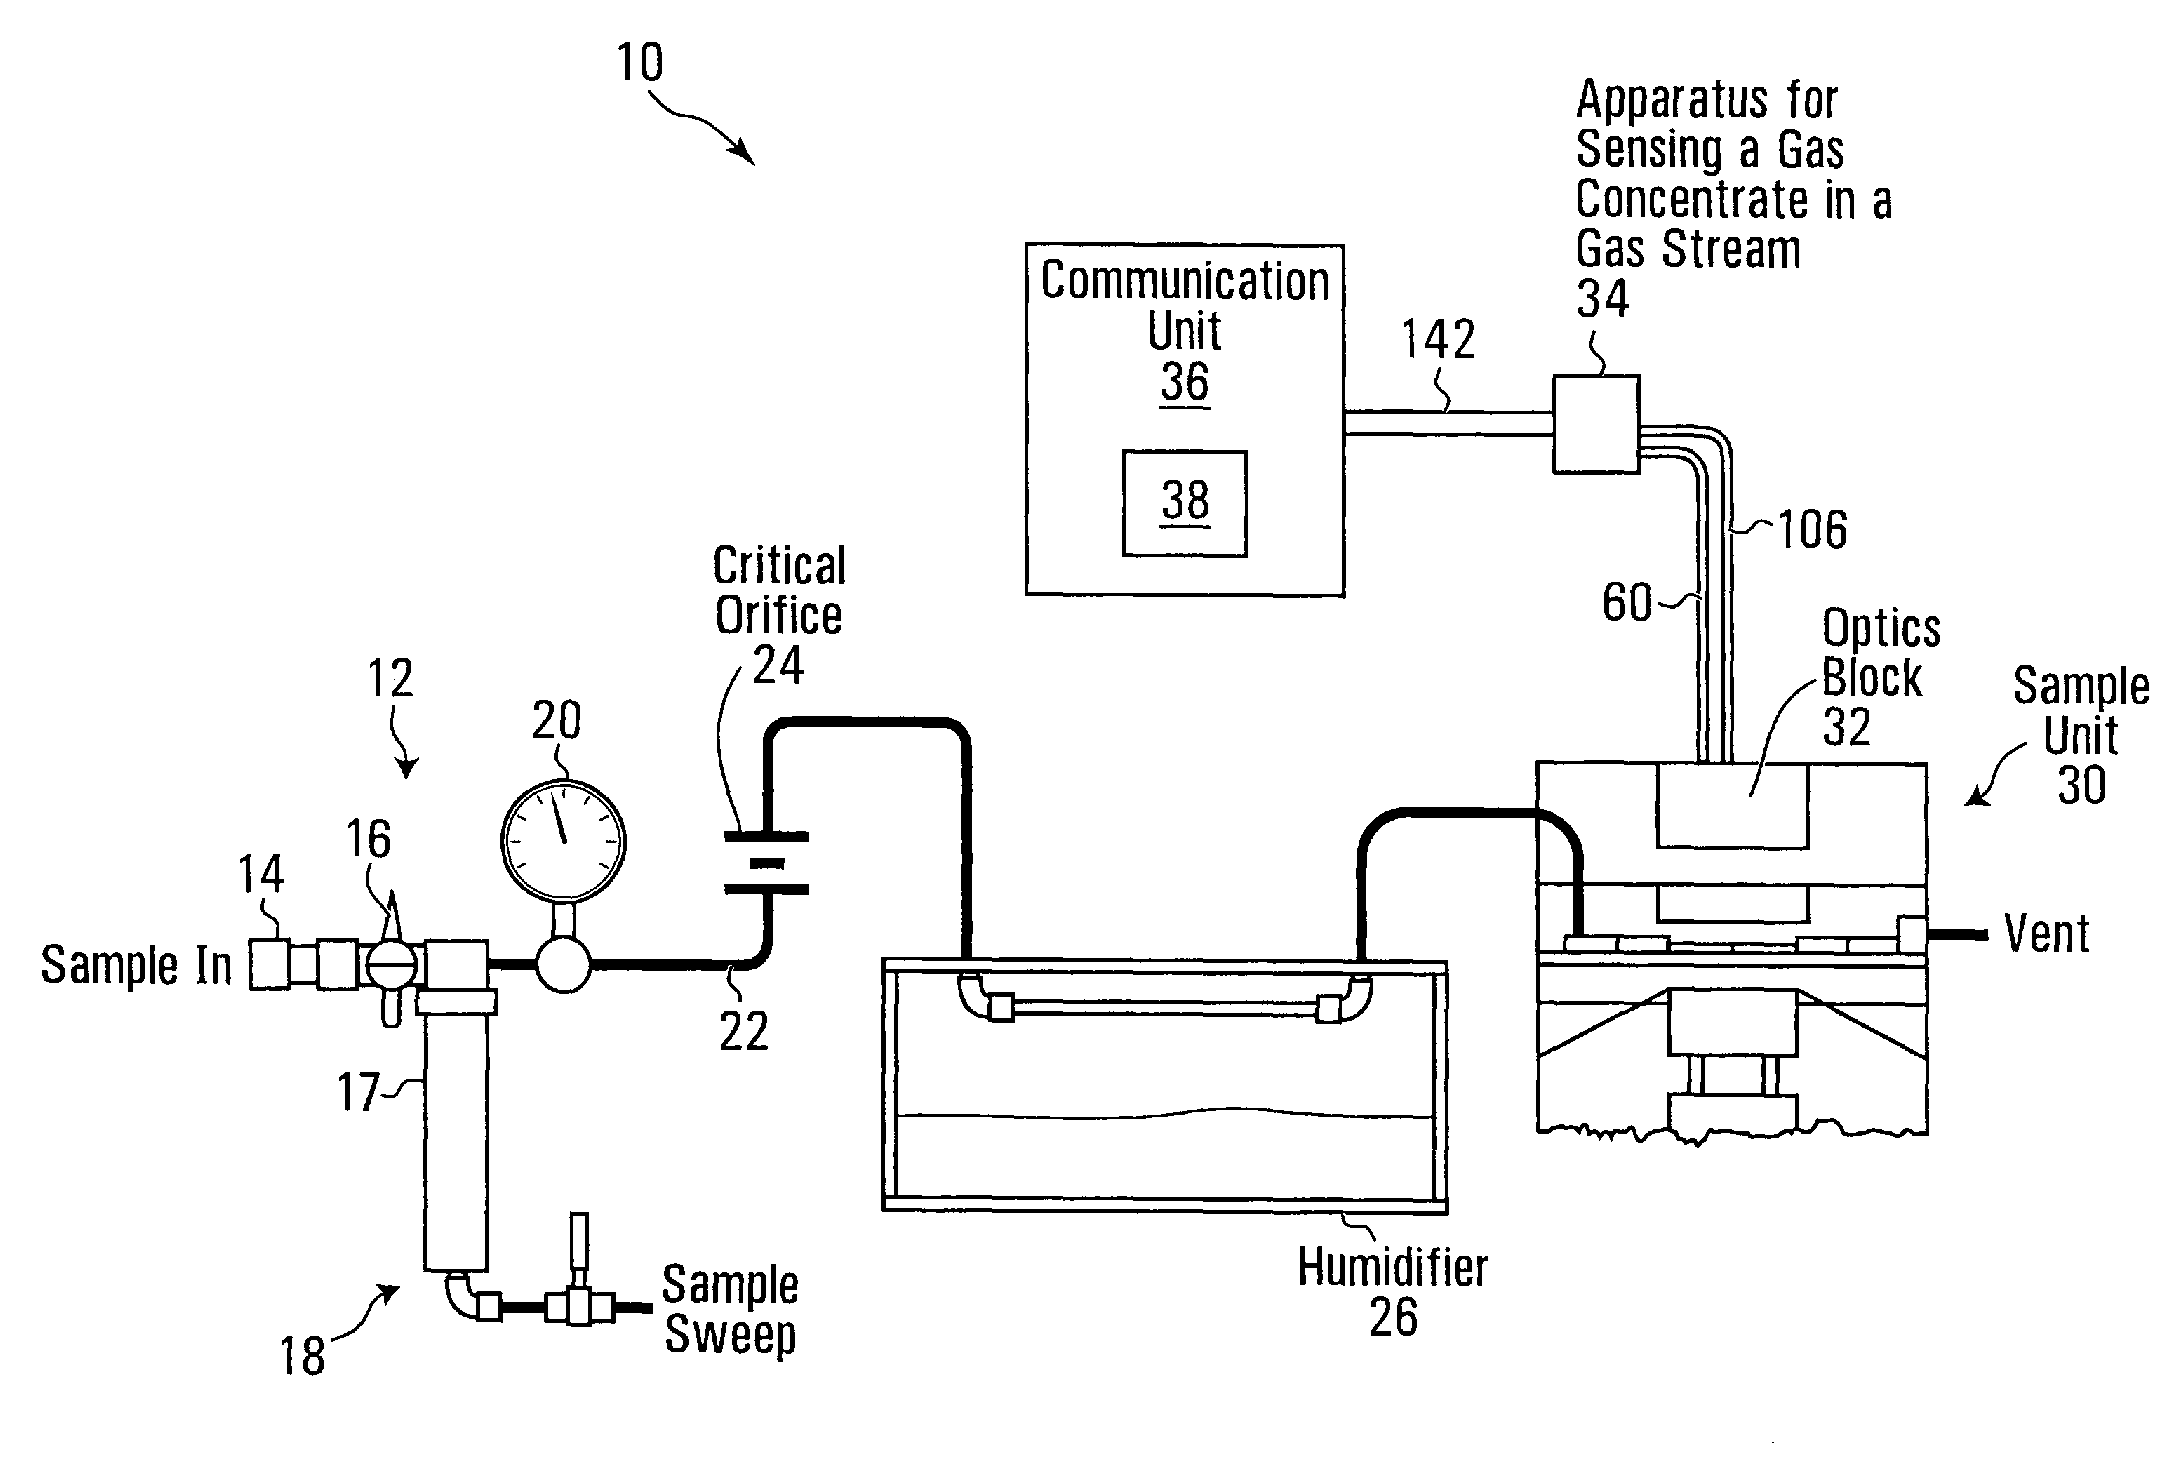
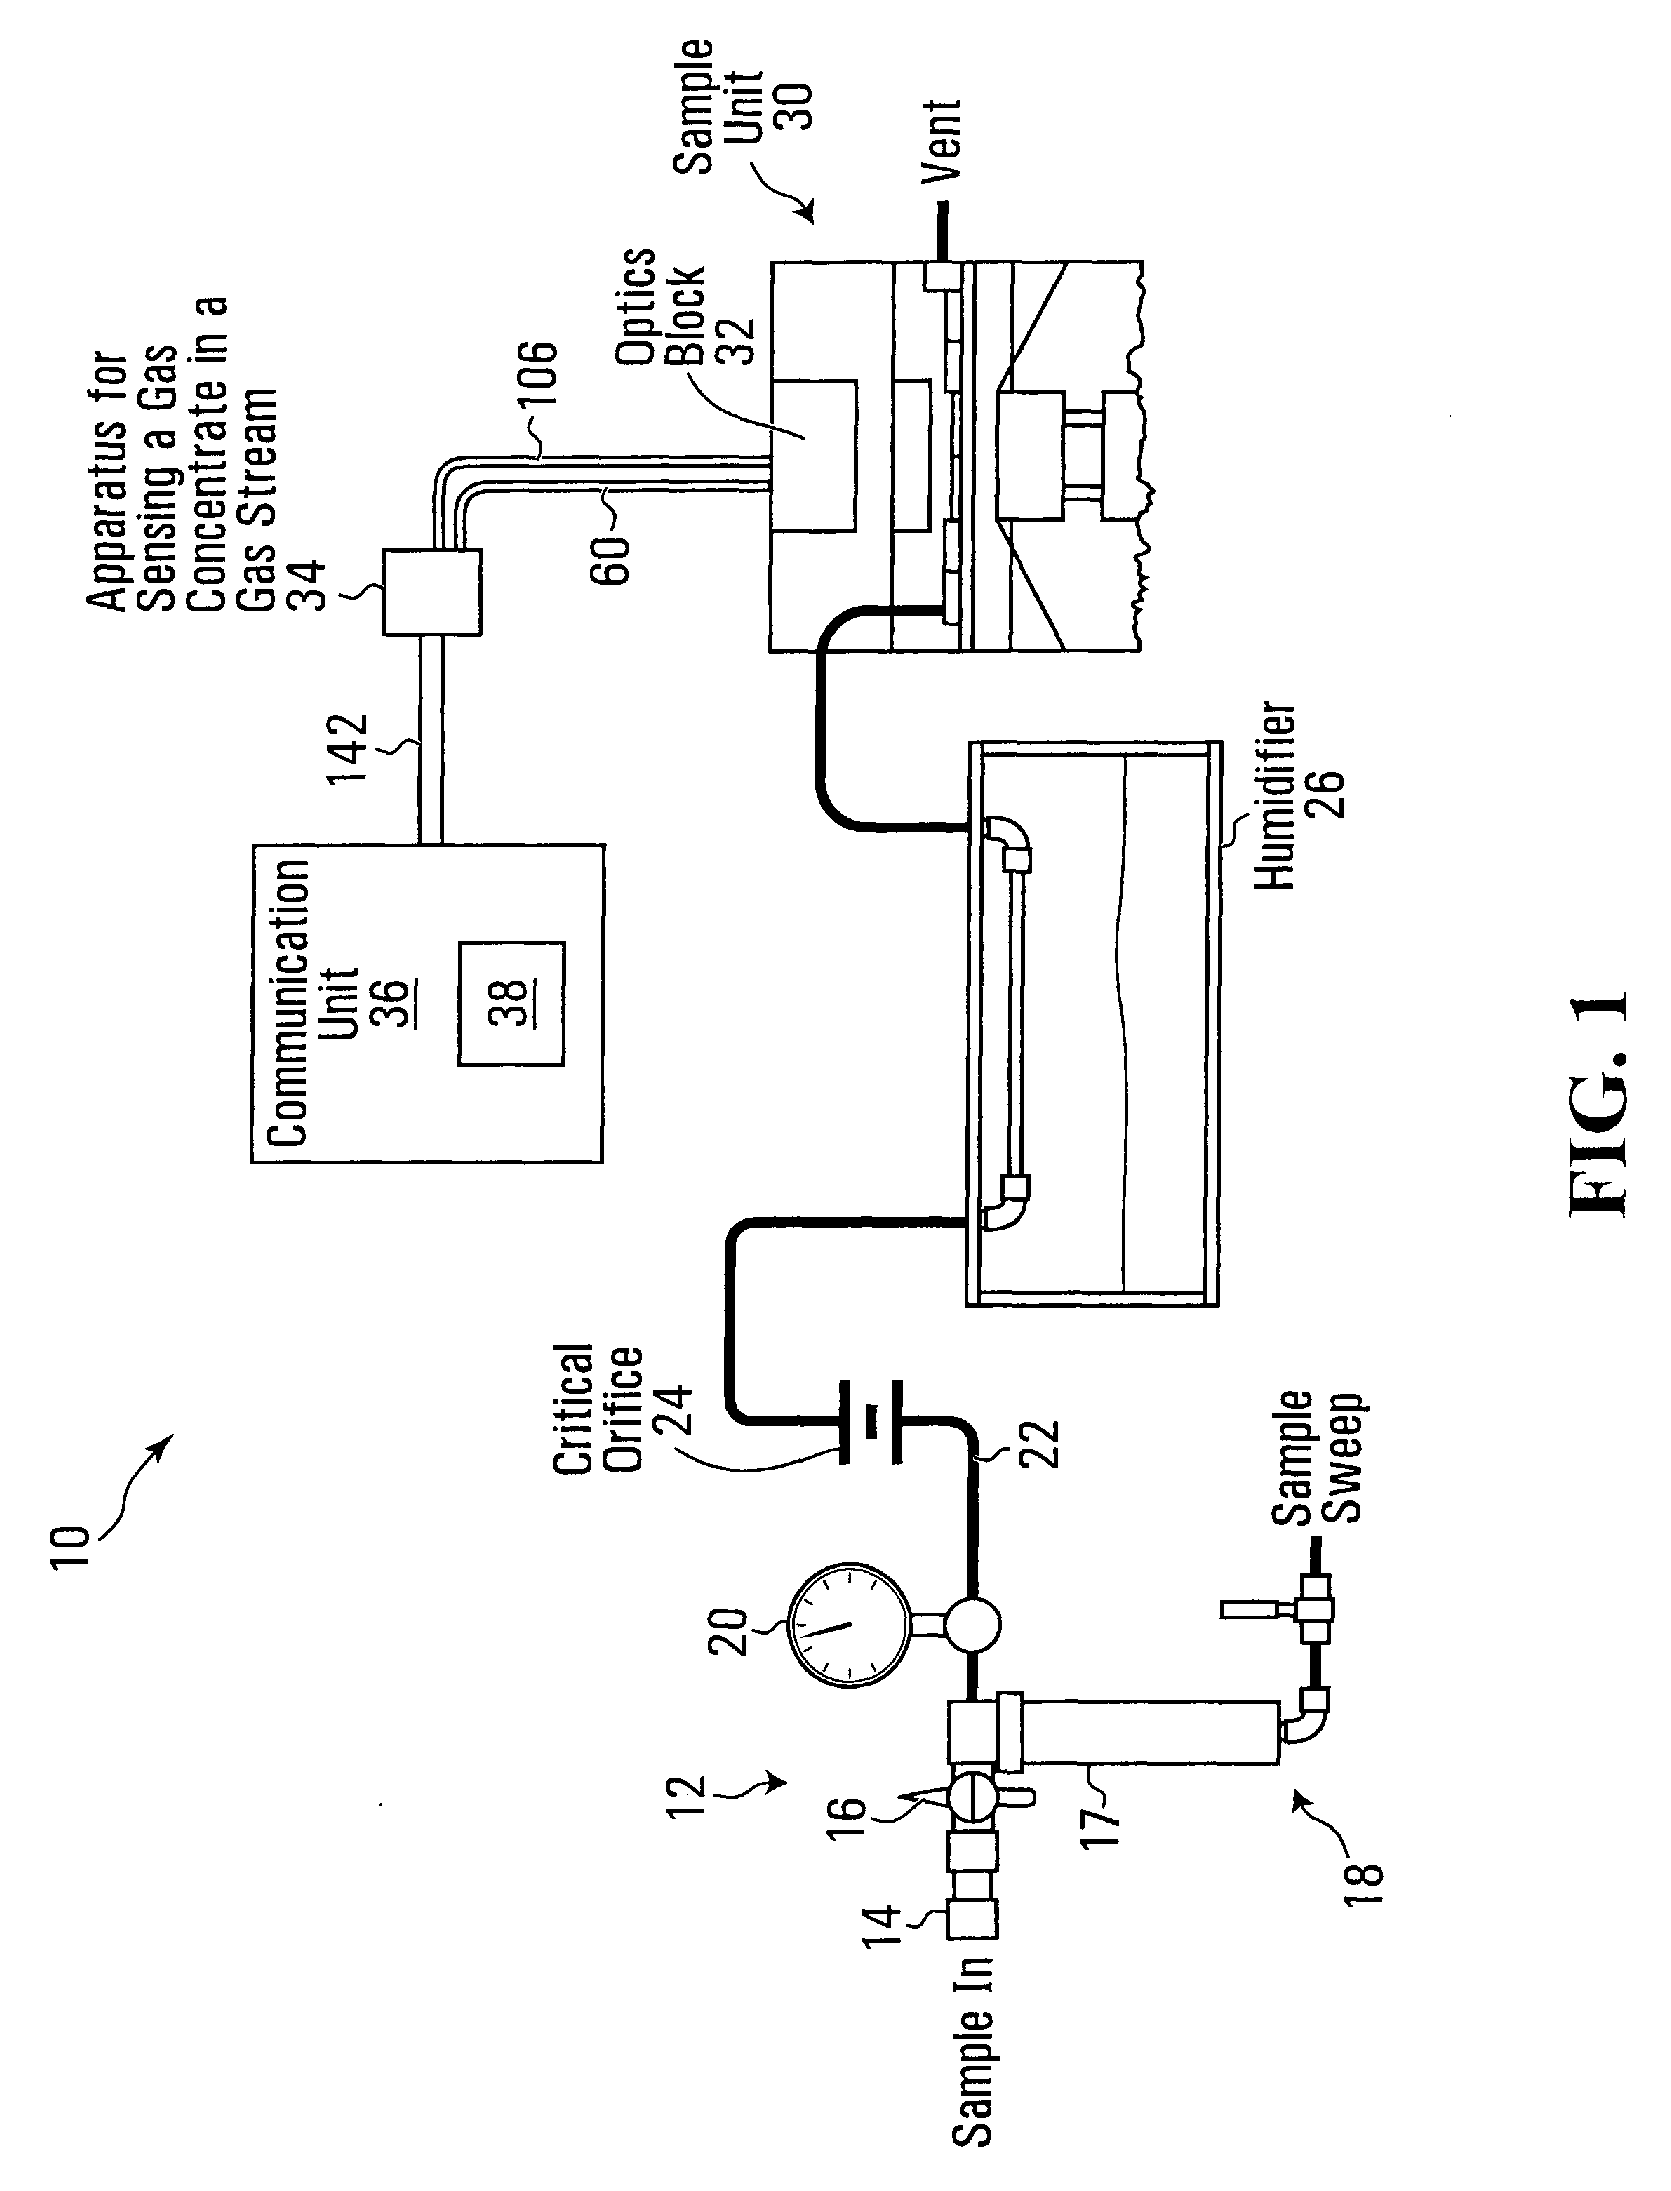
[0063]Referring to FIG. 1, a system for measuring a concentration of a gas in a gas stream is shown generally at 10. The system 10 includes a gas sample system shown generally at 12, having a sample inlet 14 for receiving a gas stream from a gas source (not shown). The sample inlet 14 is in fluid communication with a valve 16 which is further in communication with a pressure regulator 17 and a flushing circuit 18 for flushing the sample system 12. The valve 16 is further in communication with a pressure gauge 20 and an outlet 22.

[0064]Essentially, the sample system 12 receives the gas stream at the sample inlet 14 and employs the valve 16 and pressure regulator 17 to cause the gas to appear at the outlet 22 at a desired pressure as indicated by the pressure gauge 20. The flushing system 18 simply allows the pressure regulator, pressure gauge and outlet 22 to be flushed free of residual gas to clean out the system 10, as desired.

[0065]The system 10 further includes a critical orifice...


PUM


Abstract

A process and apparatus for sensing gas concentration in a gas stream involves producing a succession of difference values representing differences between successive sample values of a succession of sample values representing instantaneous reflectance of light from a compound produced by reacting a reagent with the gas being sensed and producing a gas concentration value in response to a maximum difference value of the succession of difference values.

Description

FIELD OF THE INVENTION[0001]This invention relates to measuring the concentration of a gas in a gas stream and more particularly to the use of slope detection in a signal representing instantaneous reflectance of light from a compound produced by reacting the gas to be detected with a reagent.BACKGROUND OF THE INVENTION[0002]Various methods are known for sensing gas concentration in a gas stream. For detecting hydrogen sulfide, tape analyzers are typically used. Hydrogen sulfide (H2S) tape analyzers generally operate by causing a gas stream to enter a reaction chamber through an aperture and permitting the hydrogen sulfide in the gas steam to react with lead acetate on a portion of lead acetate-impregnated paper tape. As the lead acetate reacts with the H2S in the gas stream, lead sulfide is formed on the tape. As the reaction proceeds the lead sulfide build up is visible as a brown stain on the tape. Reflectance of light from the lead sulfide is measured using a photo-detector to p...

Claims


Application Information

Patent Timeline
IPC IPC(8): G01N21/55
CPCG01N21/8483G01N21/783
Inventor RICHARDSON, LUKE EDWARDBUSH, PETER DOUGLAS
Owner GALVANIC APPLIED SCI
Learn More