
Interactive diagnostic display system

a diagnostic display and diagnostic data technology, applied in the field of diagnostic data display, can solve the problems of unclear or otherwise inadequate images generated directly from raw diagnostic data, and achieve the effect of reducing the disadvantages and eliminating the problems of previous diagnostic display techniques

Inactive Publication Date: 2008-10-09
THE TRUSTEES OF COLUMBIA UNIV IN THE CITY OF NEW YORK
View PDF11 Cites 26 Cited by
  • Summary
  • Abstract
  • Description
  • Claims
  • Application Information

AI Technical Summary

Benefits of technology

[0004]According to the present invention, disadvantages and problems associated with previous diagnostic display techniques may be reduced or eliminated.
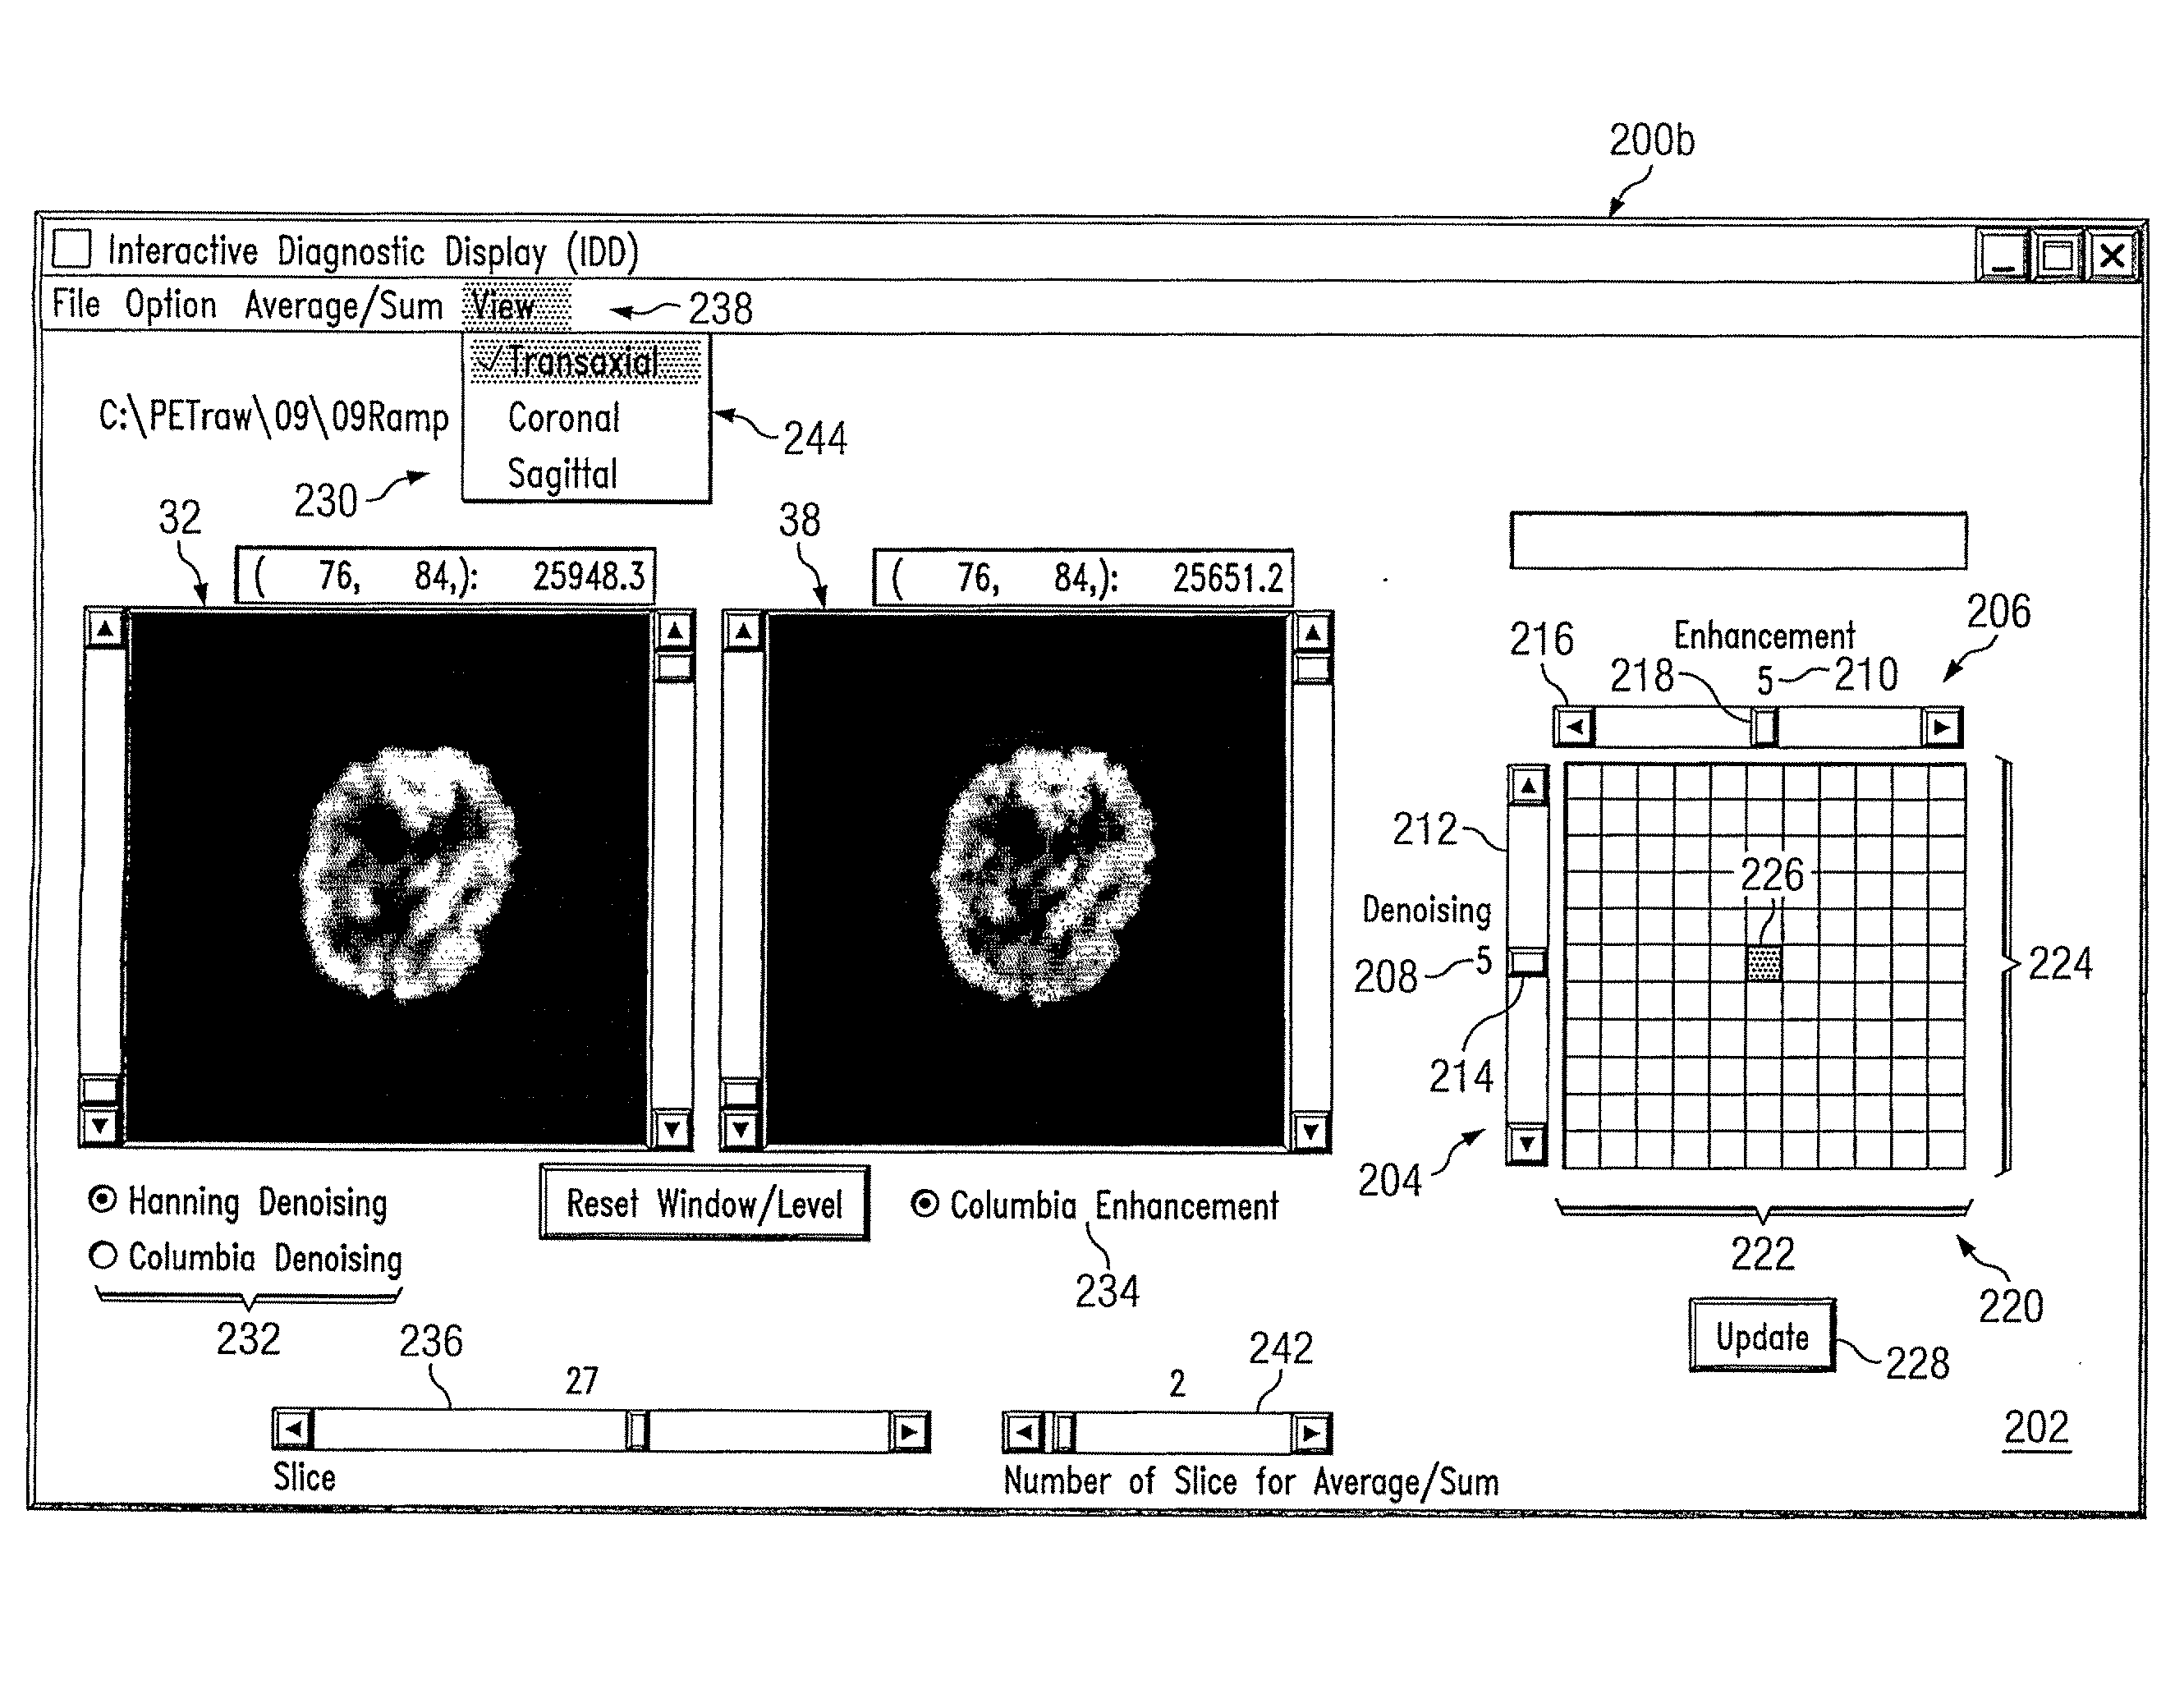
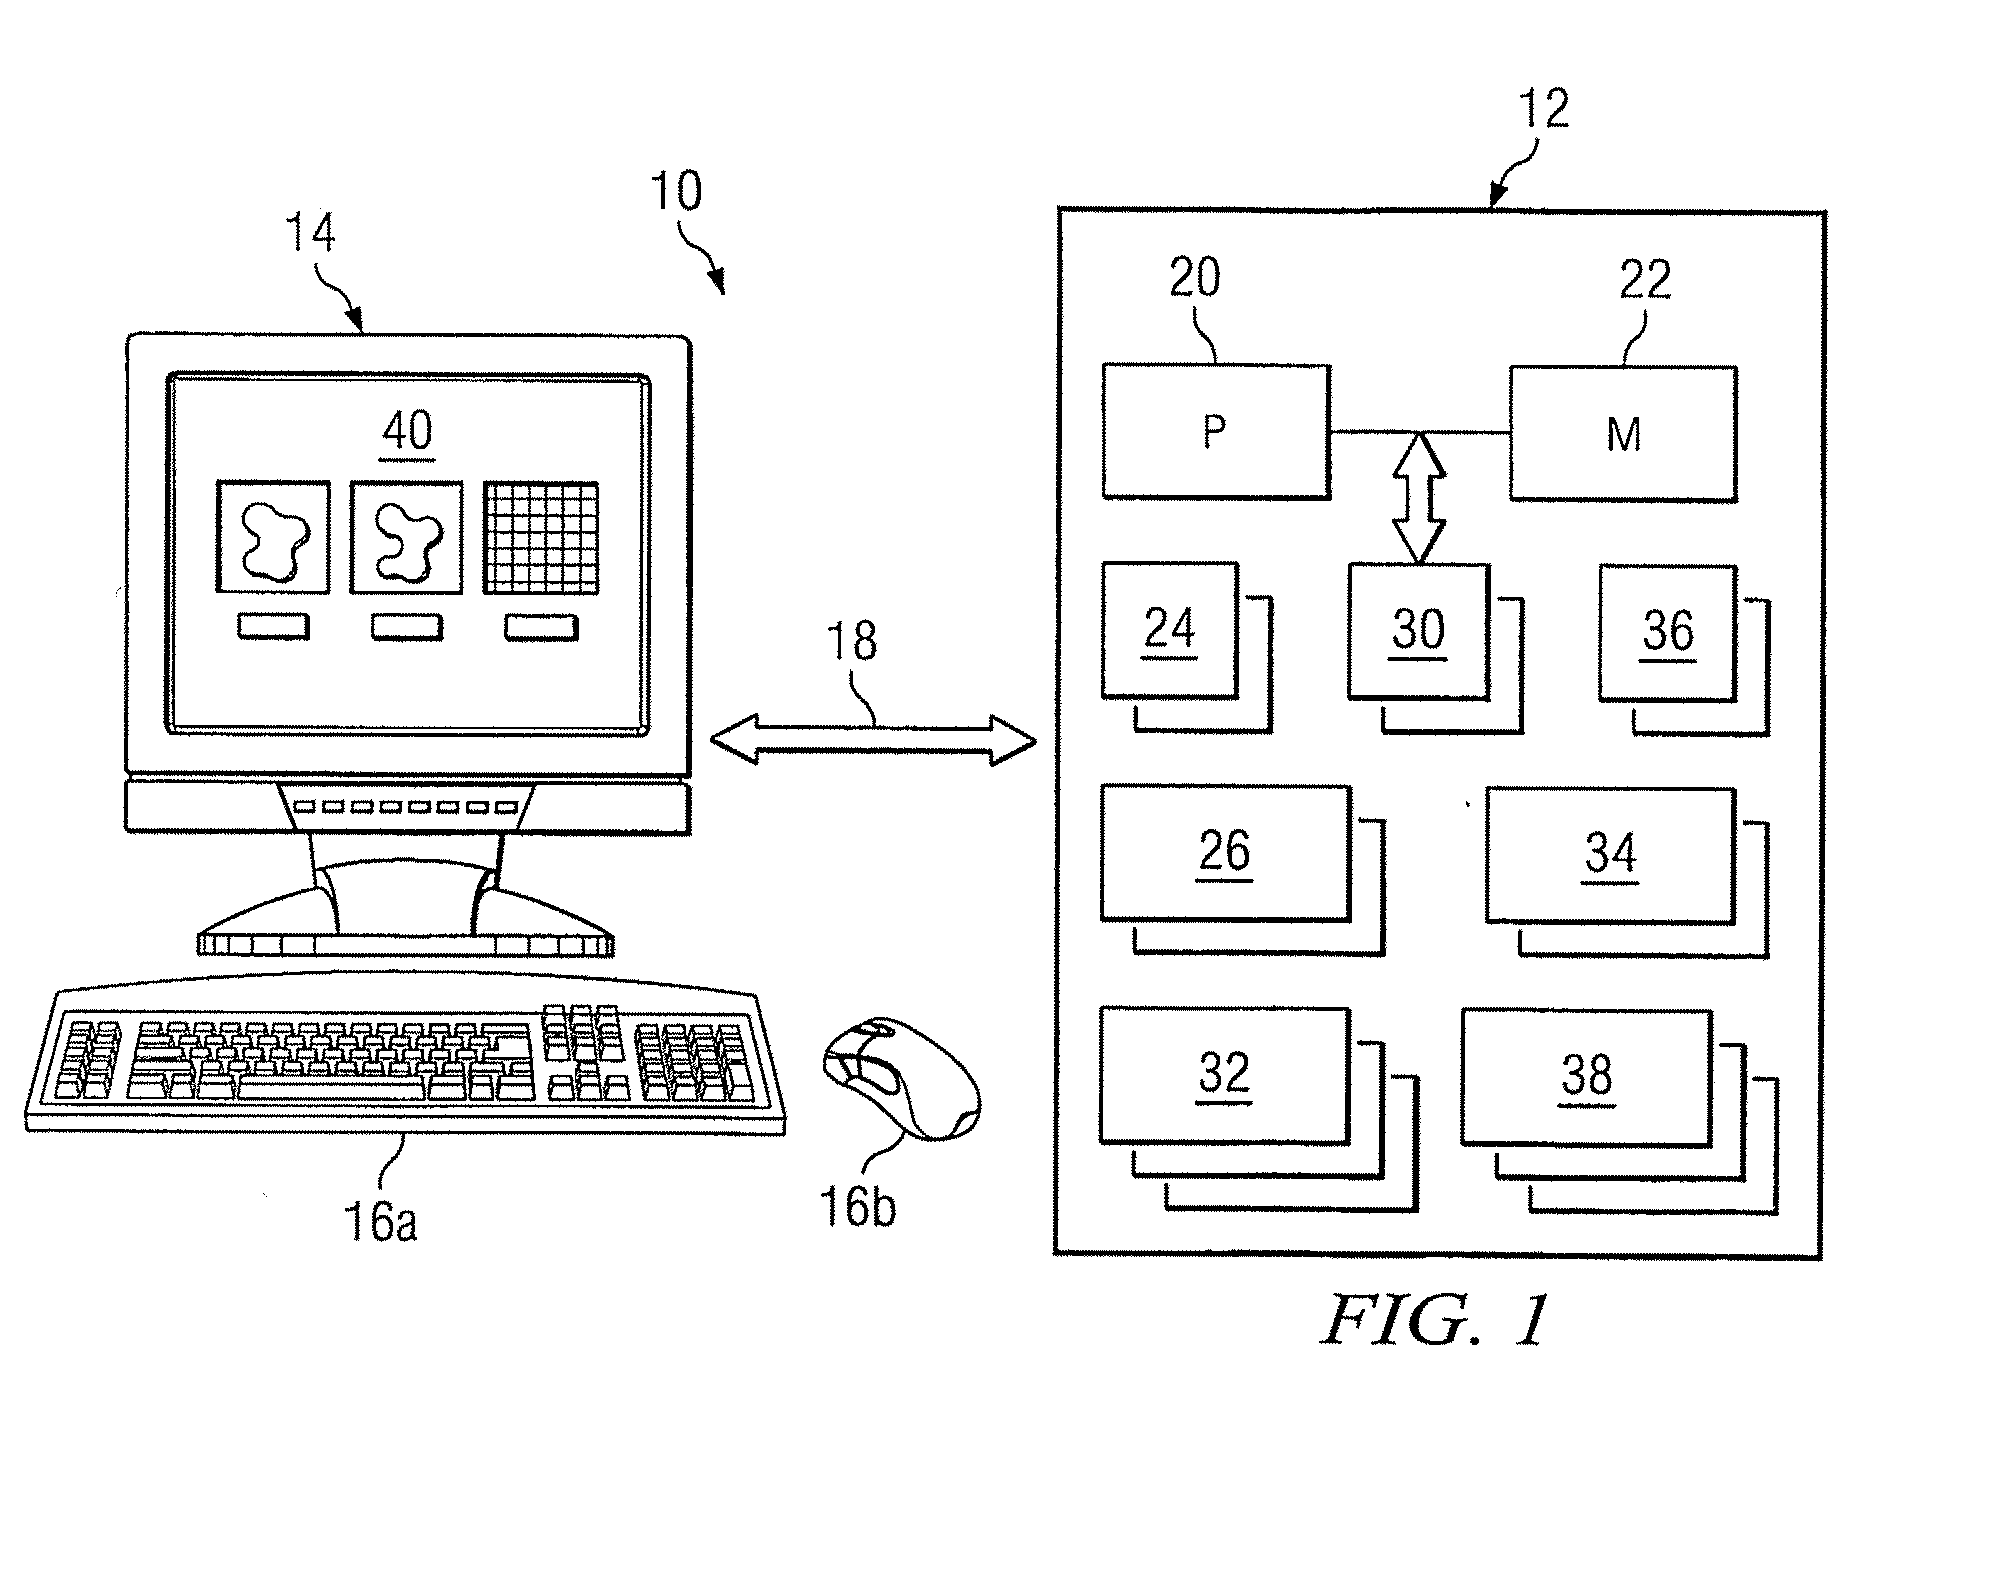
[0005]In certain embodiments, a computer-implemented interactive diagnostic display system includes a processing module and a display module. The processing module is operable to: (1) access diagnostic data derived from measurement of one or more characteristics of a selected region of a patient's body; (2) receive a user-selected value that specifies underlying values of one or more parameters of a processing algorithm to specify a particular processing algorithm that is to be applied to the diagnostic data to generate processed diagnostic data, the user-selected value abstracting the underlying values such that the user need not have knowledge of these underlying values to specify optimal processing for generating an image reflecting the user-selected value; (3) apply the particular processing algorithm to the diagnostic data according to the user-selected value to generate the processed diagnostic data; (4) generate the image reflecting the processed diagnostic data; and (5) communicate the image for display. The display module is operable to: (1) display the image; and (2) display a selection icon, in association with the displayed image, allowing a user to interactively adjust the user-selected value to adjust the underlying values for generation of a new image.
[0008]Particular embodiments of the present invention may provide one or more technical advantages. Certain of these advantages may assist users such as medical doctors or other medical personnel in diagnosing and treating patients. Previous diagnostic display tools typically require the user to specify or adjust a number of parameters of one or more processing algorithms to display an image that is optimized for the user's particular diagnostic purposes relative to an image generated directly from raw diagnostic data. Often, the parameters that must be specified or adjusted are not intuitive or are otherwise difficult for the user to comprehend without specialized knowledge of the underlying processing algorithms.
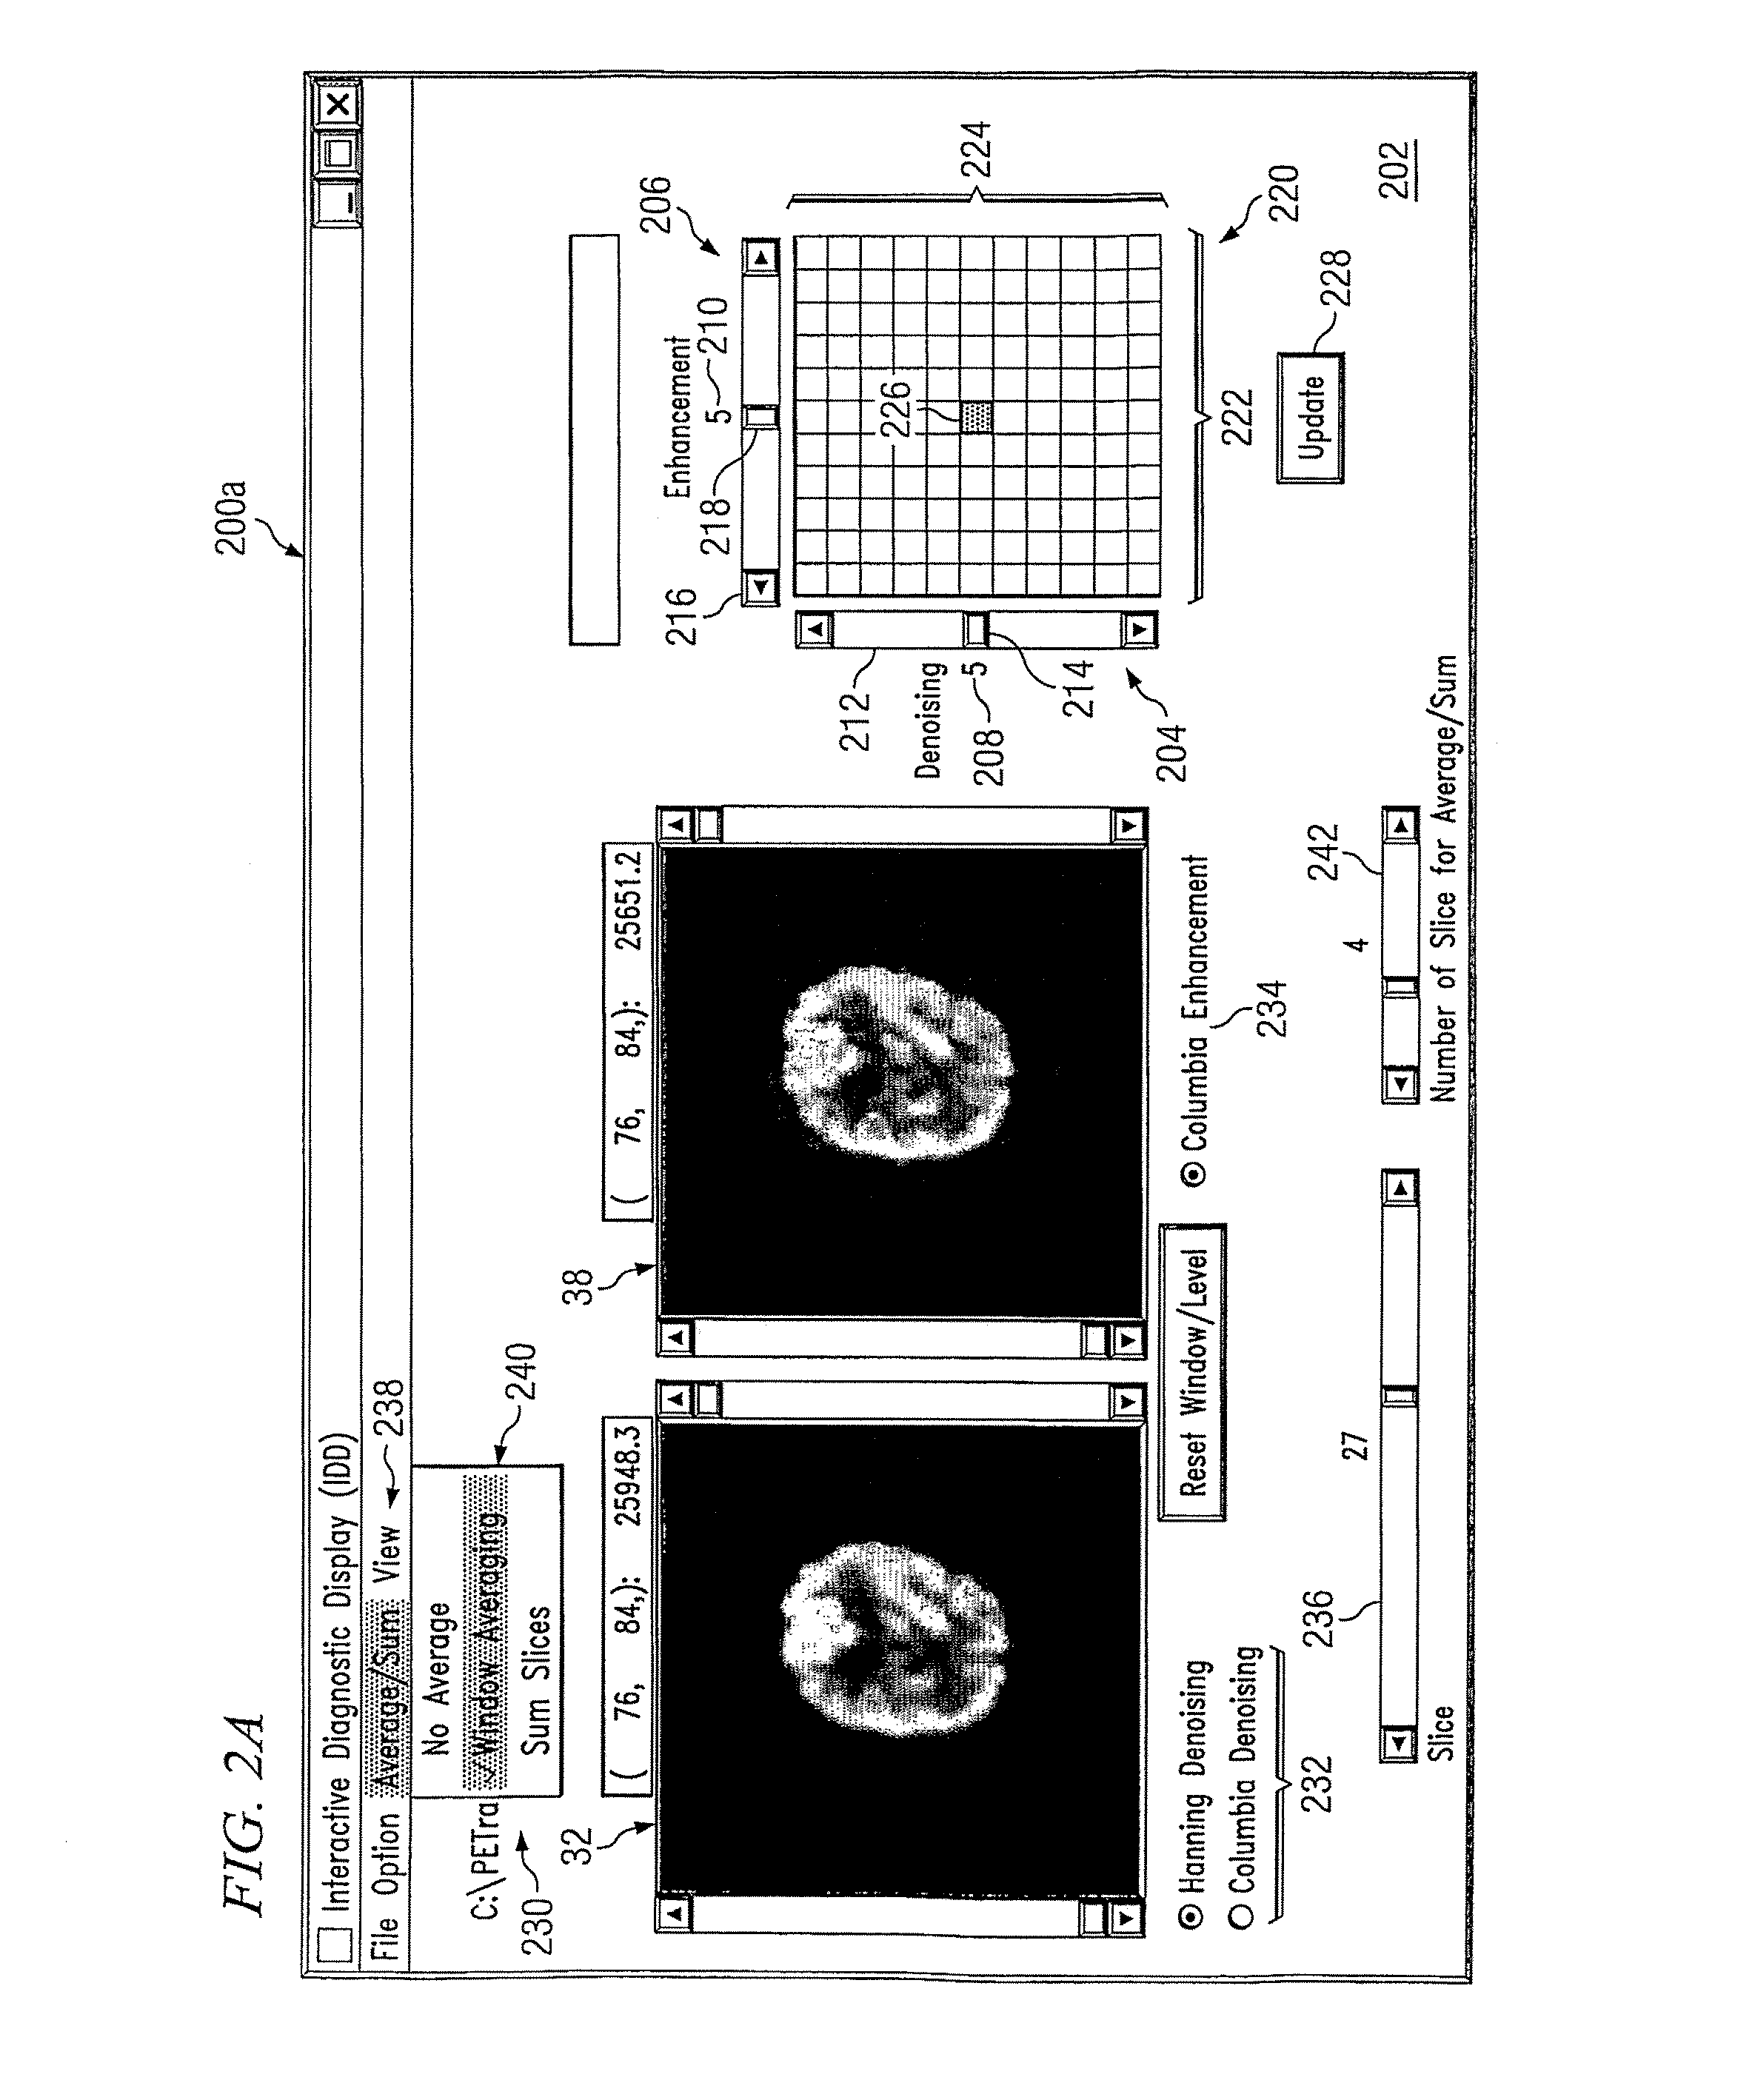
[0010]Previous systems typically display only images reflecting raw diagnostic data and images reflecting the result of combined denoising and enhancement with respect to the raw diagnostic data. Previous systems typically do not display a denoised image from the result only of denoising with respect to the raw diagnostic data. In certain embodiments, in contrast to previous techniques, the present invention displays simultaneously: (1) a denoised image from the result only of denoising with respect to the raw diagnostic data; and (2) an enhanced image from the result of enhancement with respect to the denoised diagnostic data. Applying a denoising algorithm to the raw diagnostic data to generate denoised diagnostic data may yield a linear relationship between the raw diagnostic data and the denoised diagnostic data, and an accurate and smooth denoised image, to facilitate quantitative diagnostic analysis. In certain embodiments, the denoised diagnostic data may be preserved for such analysis. Applying an enhancement algorithm to the denoised diagnostic data to generate enhanced denoised diagnostic data may yield an enhanced image that provides improved visualization (e.g., improved contrast and spatial resolution) and facilitates quantitative diagnostic analysis. In certain embodiments, displaying simultaneously the denoised image with the corresponding enhanced images provides valuable diagnostic benefits.
[0011]In certain embodiments, the present invention provides graphical tools to allow the user to adjust, interactively and intuitively, the denoising value to adjust the underlying parameter values of the denoising algorithm, the enhancement value to adjust the underlying parameter values of the enhancement algorithm, or both. In certain embodiments, the present invention provides graphical tools to allow the user to adjust simultaneously the denoising value and the enhancement value. In certain embodiments, in response to the user adjusting such a user-selected value, the present invention generates and displays in substantially real time a modified image reflecting the adjustment to the associated underlying parameter values. For example, in response to the user adjusting the denoising value, the present invention may generate and display in substantially real time both a new denoising image from the new denoised diagnostic data and a new enhancement image from the corresponding new enhanced denoised diagnostic data. In certain embodiments, the ability for the user to intuitively and interactively adjust such values to control the underlying denoising and enhancement algorithms and associated parameters, and view in substantially real time the results of such adjustments on the denoised and enhanced images, provides valuable diagnostic benefits, especially where the user lacks specialized knowledge of the underlying algorithms and associated parameters.

Problems solved by technology

Images generated directly from raw diagnostic data may be unclear or otherwise inadequate.

Method used


Image

  • Interactive diagnostic display system
  • Interactive diagnostic display system
  • Interactive diagnostic display system

Examples


example processing

Algorithm

[0088]The following description provides additional details regarding the one or more processing algorithms used to generate the one or more images provided by the interactive diagnostic display system of the present invention. It should be understood that this description is merely for example purposes and should not be used to limit the present invention. Moreover, the following algorithm may provide one or both of the denoising and enhancement algorithms of the present invention.

[0089]In certain embodiments, the one or more processing algorithms comprise a multi-scale adaptive thresholding scheme, which may provide a regularization process to filtered back-projection (FBP) for reconstructing diagnostic data 24. Adaptive selection of thresholding operators for each multi-scale sub-band may enable a unified process for noise removal and feature enhancement. A cross-scale regularization process may provide an effective signal recovering operator, Together with non-linear th...


PUM


Abstract

In certain embodiments, an interactive diagnostic display system comprises a database, a digital data processing device, and a display. The database includes: (1) diagnostic data based on measurements of one or more characteristics of a patient's body; (2) denoising algorithms, each corresponding to a value of a denoising parameter; and (3) enhancement algorithms, each corresponding to a value of an enhancement parameter. The digital data processing device is operatively coupled to the database and configured to: (1) receive a denoising value and an enhancement value from a client input device; (2) based on the denoising value, apply the corresponding one of the denoising algorithms to the diagnostic data to generate denoised diagnostic data; (3) based on the enhancement value, apply the corresponding one of the enhancement algorithms to the denoised diagnostic data to generate enhanced denoised data; and (4) generate denoised and enhanced denoised images based on the respective denoised diagnostic data and the enhanced denoised diagnostic data. The display is operatively coupled to the digital data processing device and configured to simultaneously display the denoised diagnostic data and the enhanced denoised diagnostic data.

Description

CROSS REFERENCE TO RELATED APPLICATION[0001]This application is based on Provisional Application Ser. No. 60 / 692,678, filed Jun. 20, 2005, which is incorporated herein by reference for all purposes and from which priority is claimed.TECHNICAL FIELD OF THE INVENTION[0002]This invention relates generally to displaying diagnostic data and more particularly to an interactive diagnostic display system.BACKGROUND[0003]Devices frequently collect or generate data that is used to generate images for display on a computer system. For medical applications, this data may be diagnostic data derived from measurement of one or more characteristics of a selected region of a patient's body, such as the patient's brain. Raw diagnostic data may be processed within a computer system for generation of images to be displayed. Images generated directly from raw diagnostic data may be unclear or otherwise inadequate. Thus, it is often desirable to apply one or more processing algorithms to the raw diagnost...

Claims


Application Information

Patent Timeline
IPC IPC(8): G06F19/00
CPCG06F19/321G06F19/3406G06T5/002G06T7/0012G06T2200/24G06T2207/10072G06T2207/20008G06T2207/20092G06T2207/20192G06T2207/30004G16H40/63G16H30/40G16H30/20G16H50/20G06T5/70
Inventor LAINE, ANDREW F.JIN, YINPENGESSER, PETER D.
Owner THE TRUSTEES OF COLUMBIA UNIV IN THE CITY OF NEW YORK
Learn More