System and method of visual illustration of stock market performance

a technology of stock market performance and graphic visualization, applied in the field of phased array securities analysis graphic visualization system, can solve the problems of limited and deficiencies of what is currently being offered, difficult and time-consuming task of evaluating raw data, and most people's brains simply don't work that way

Active Publication Date: 2009-01-01
CHANGE POINT ANALYTICS
View PDF2 Cites 57 Cited by
  • Summary
  • Abstract
  • Description
  • Claims
  • Application Information

AI Technical Summary

Benefits of technology

[0017]The object of the present invention is to provide a new genre of a phased array securities analysis illustration system in the form of a new universe of profoundly higher level expression pattern recognition stock performance analysis graphs, which enable investors to easily visualize and compare the relationship of stock price movement and the underlying progression of fundamental variables, for individual companies as well as the blend of companies which are the component pieces of indexes and mutual funds

Problems solved by technology

However, the unmet desires of retail investors as they experience the chatter of media coverage and explore virtual database sources of largely academic information reveals the limitations and deficiencies of what is currently being offered.
However, as a carry-over influence from the previous dominance of large Wall Street Brokerage firms, the continuing industry wide protocol of formatting balance and income sheet information in “Databa

Method used


Image

  • System and method of visual illustration of stock market performance
  • System and method of visual illustration of stock market performance
  • System and method of visual illustration of stock market performance

Examples


Embodiment Construction

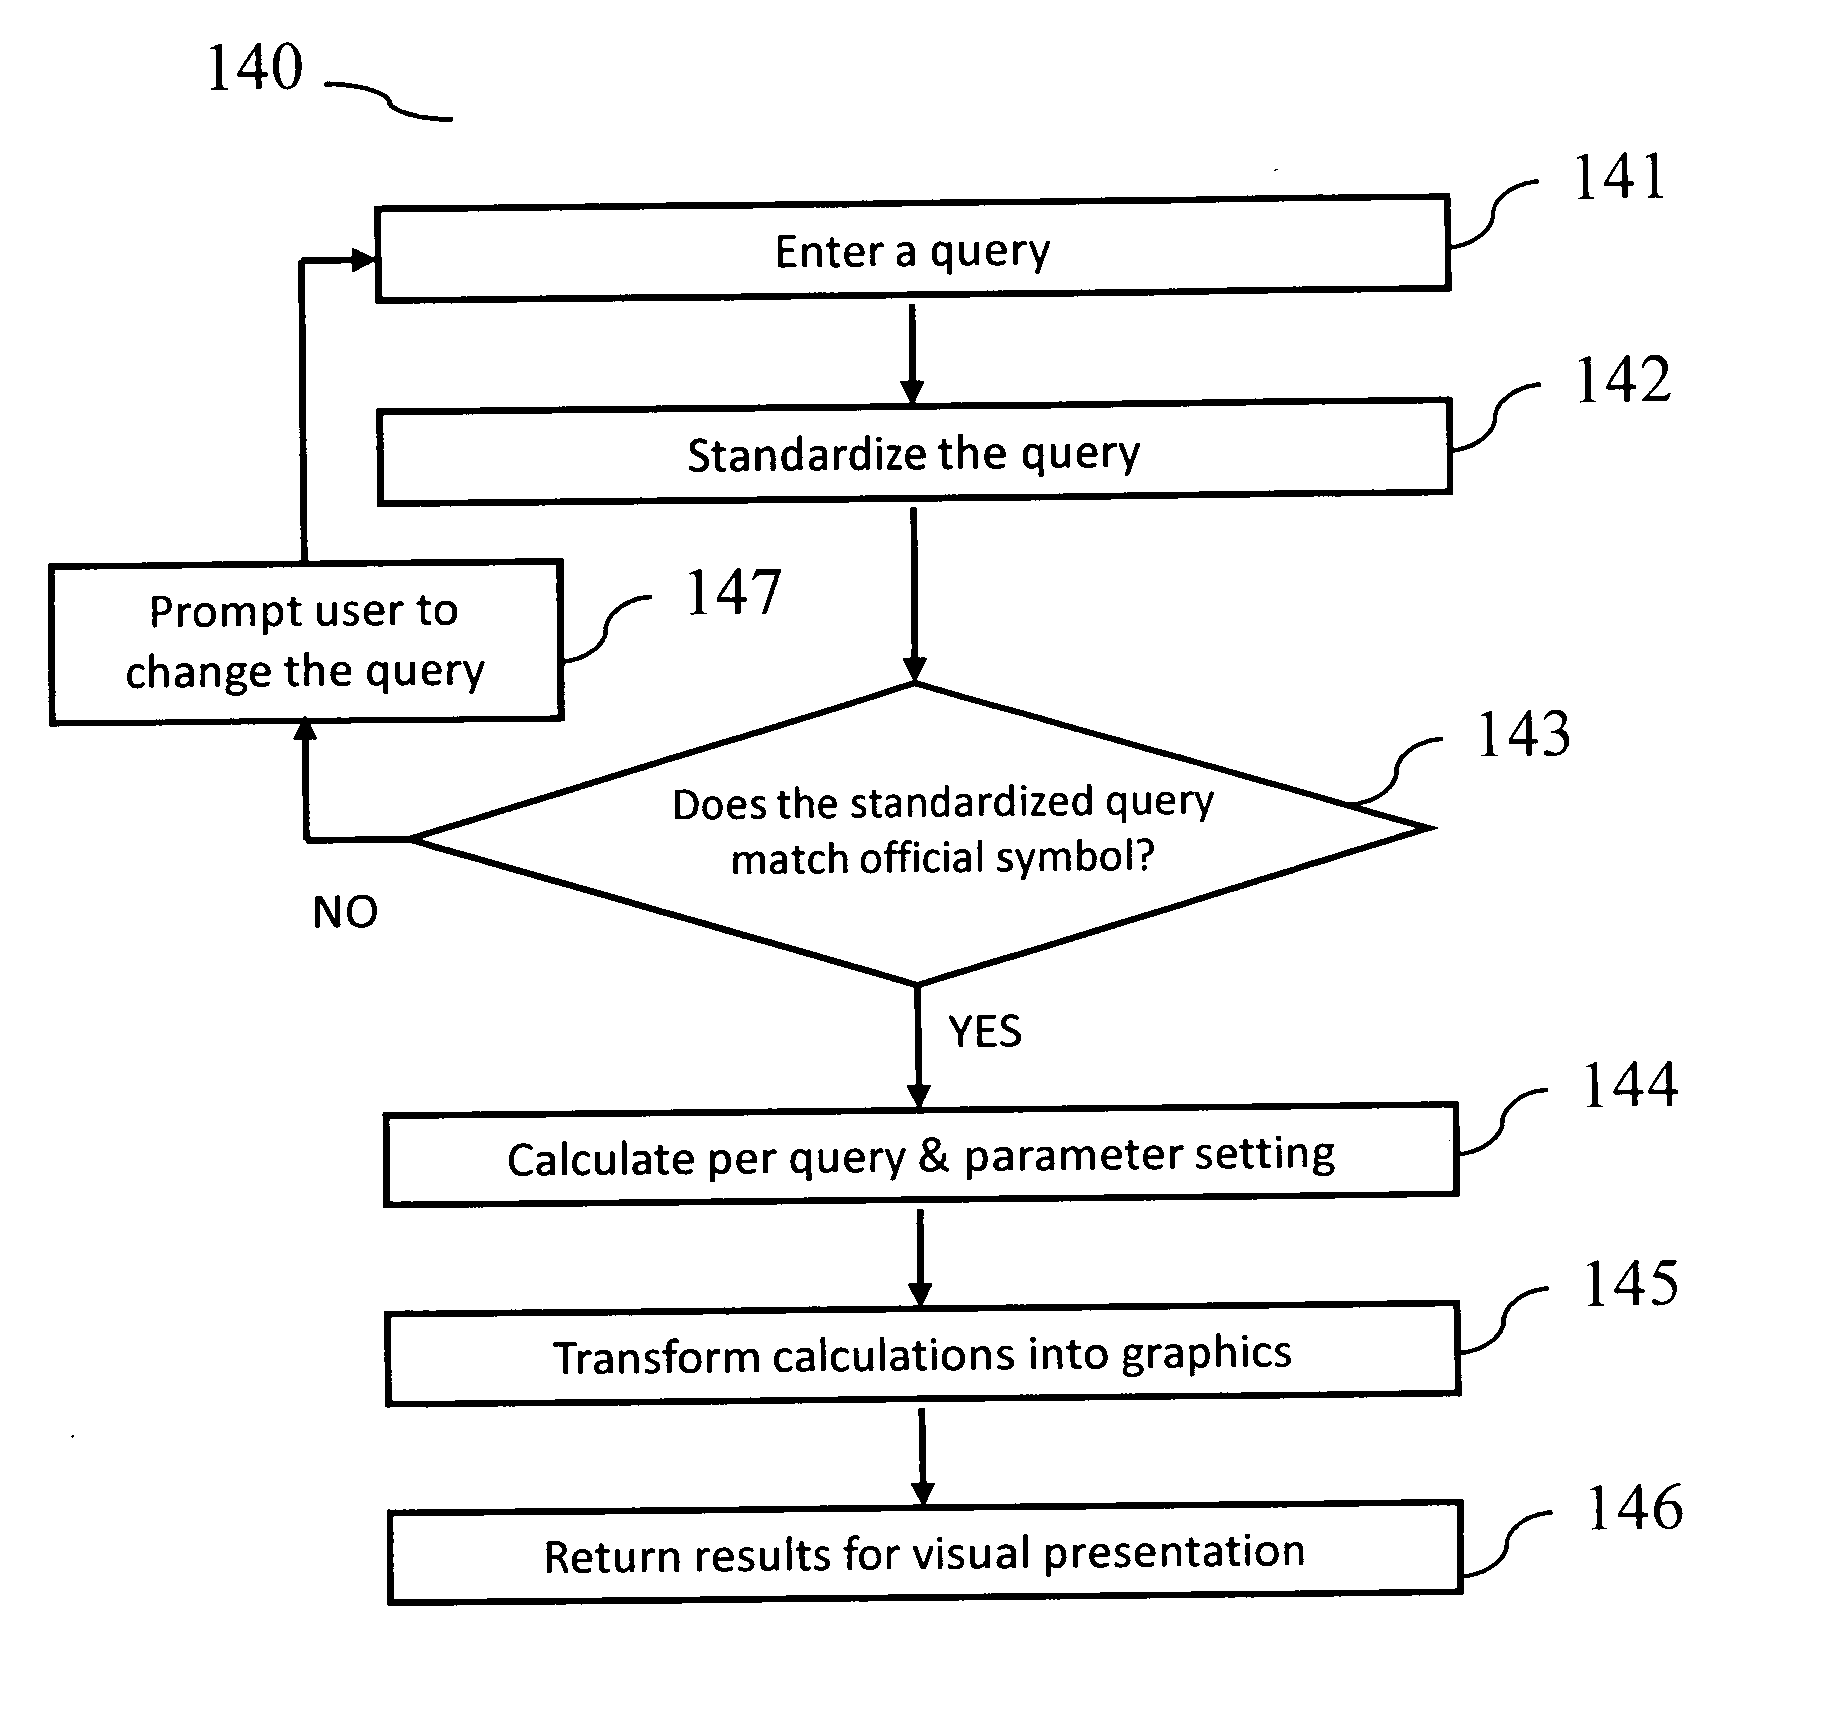
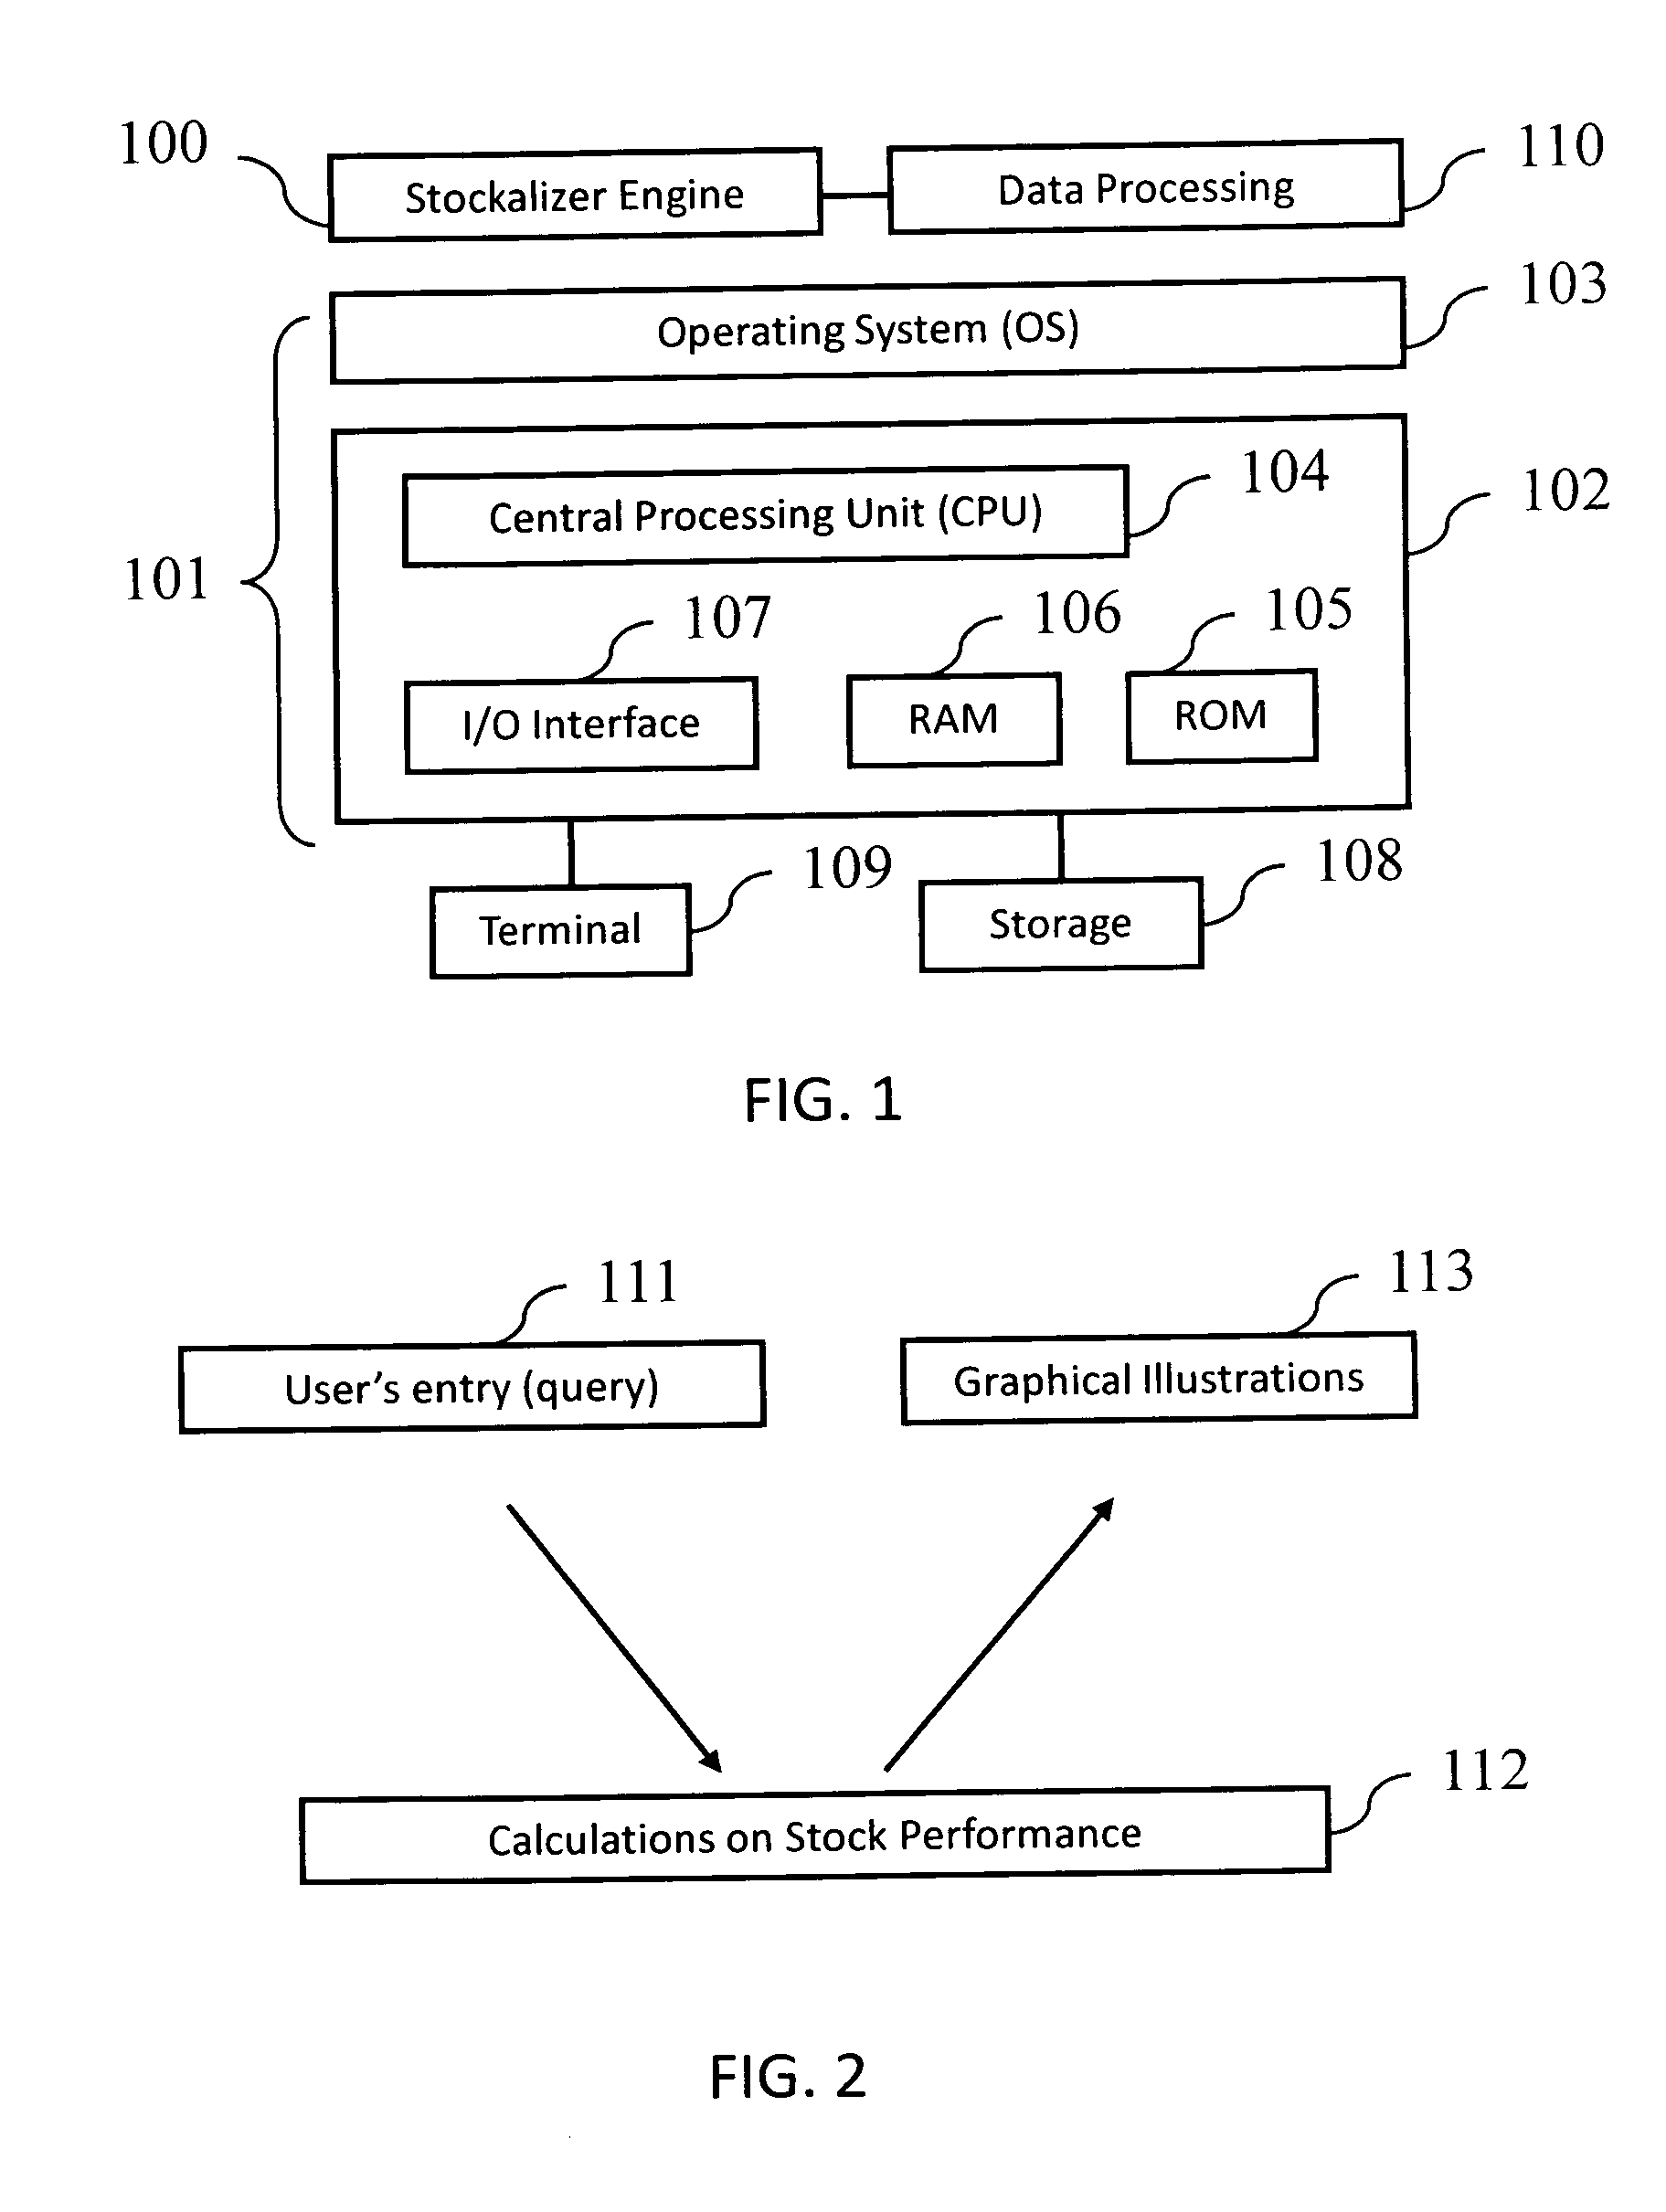
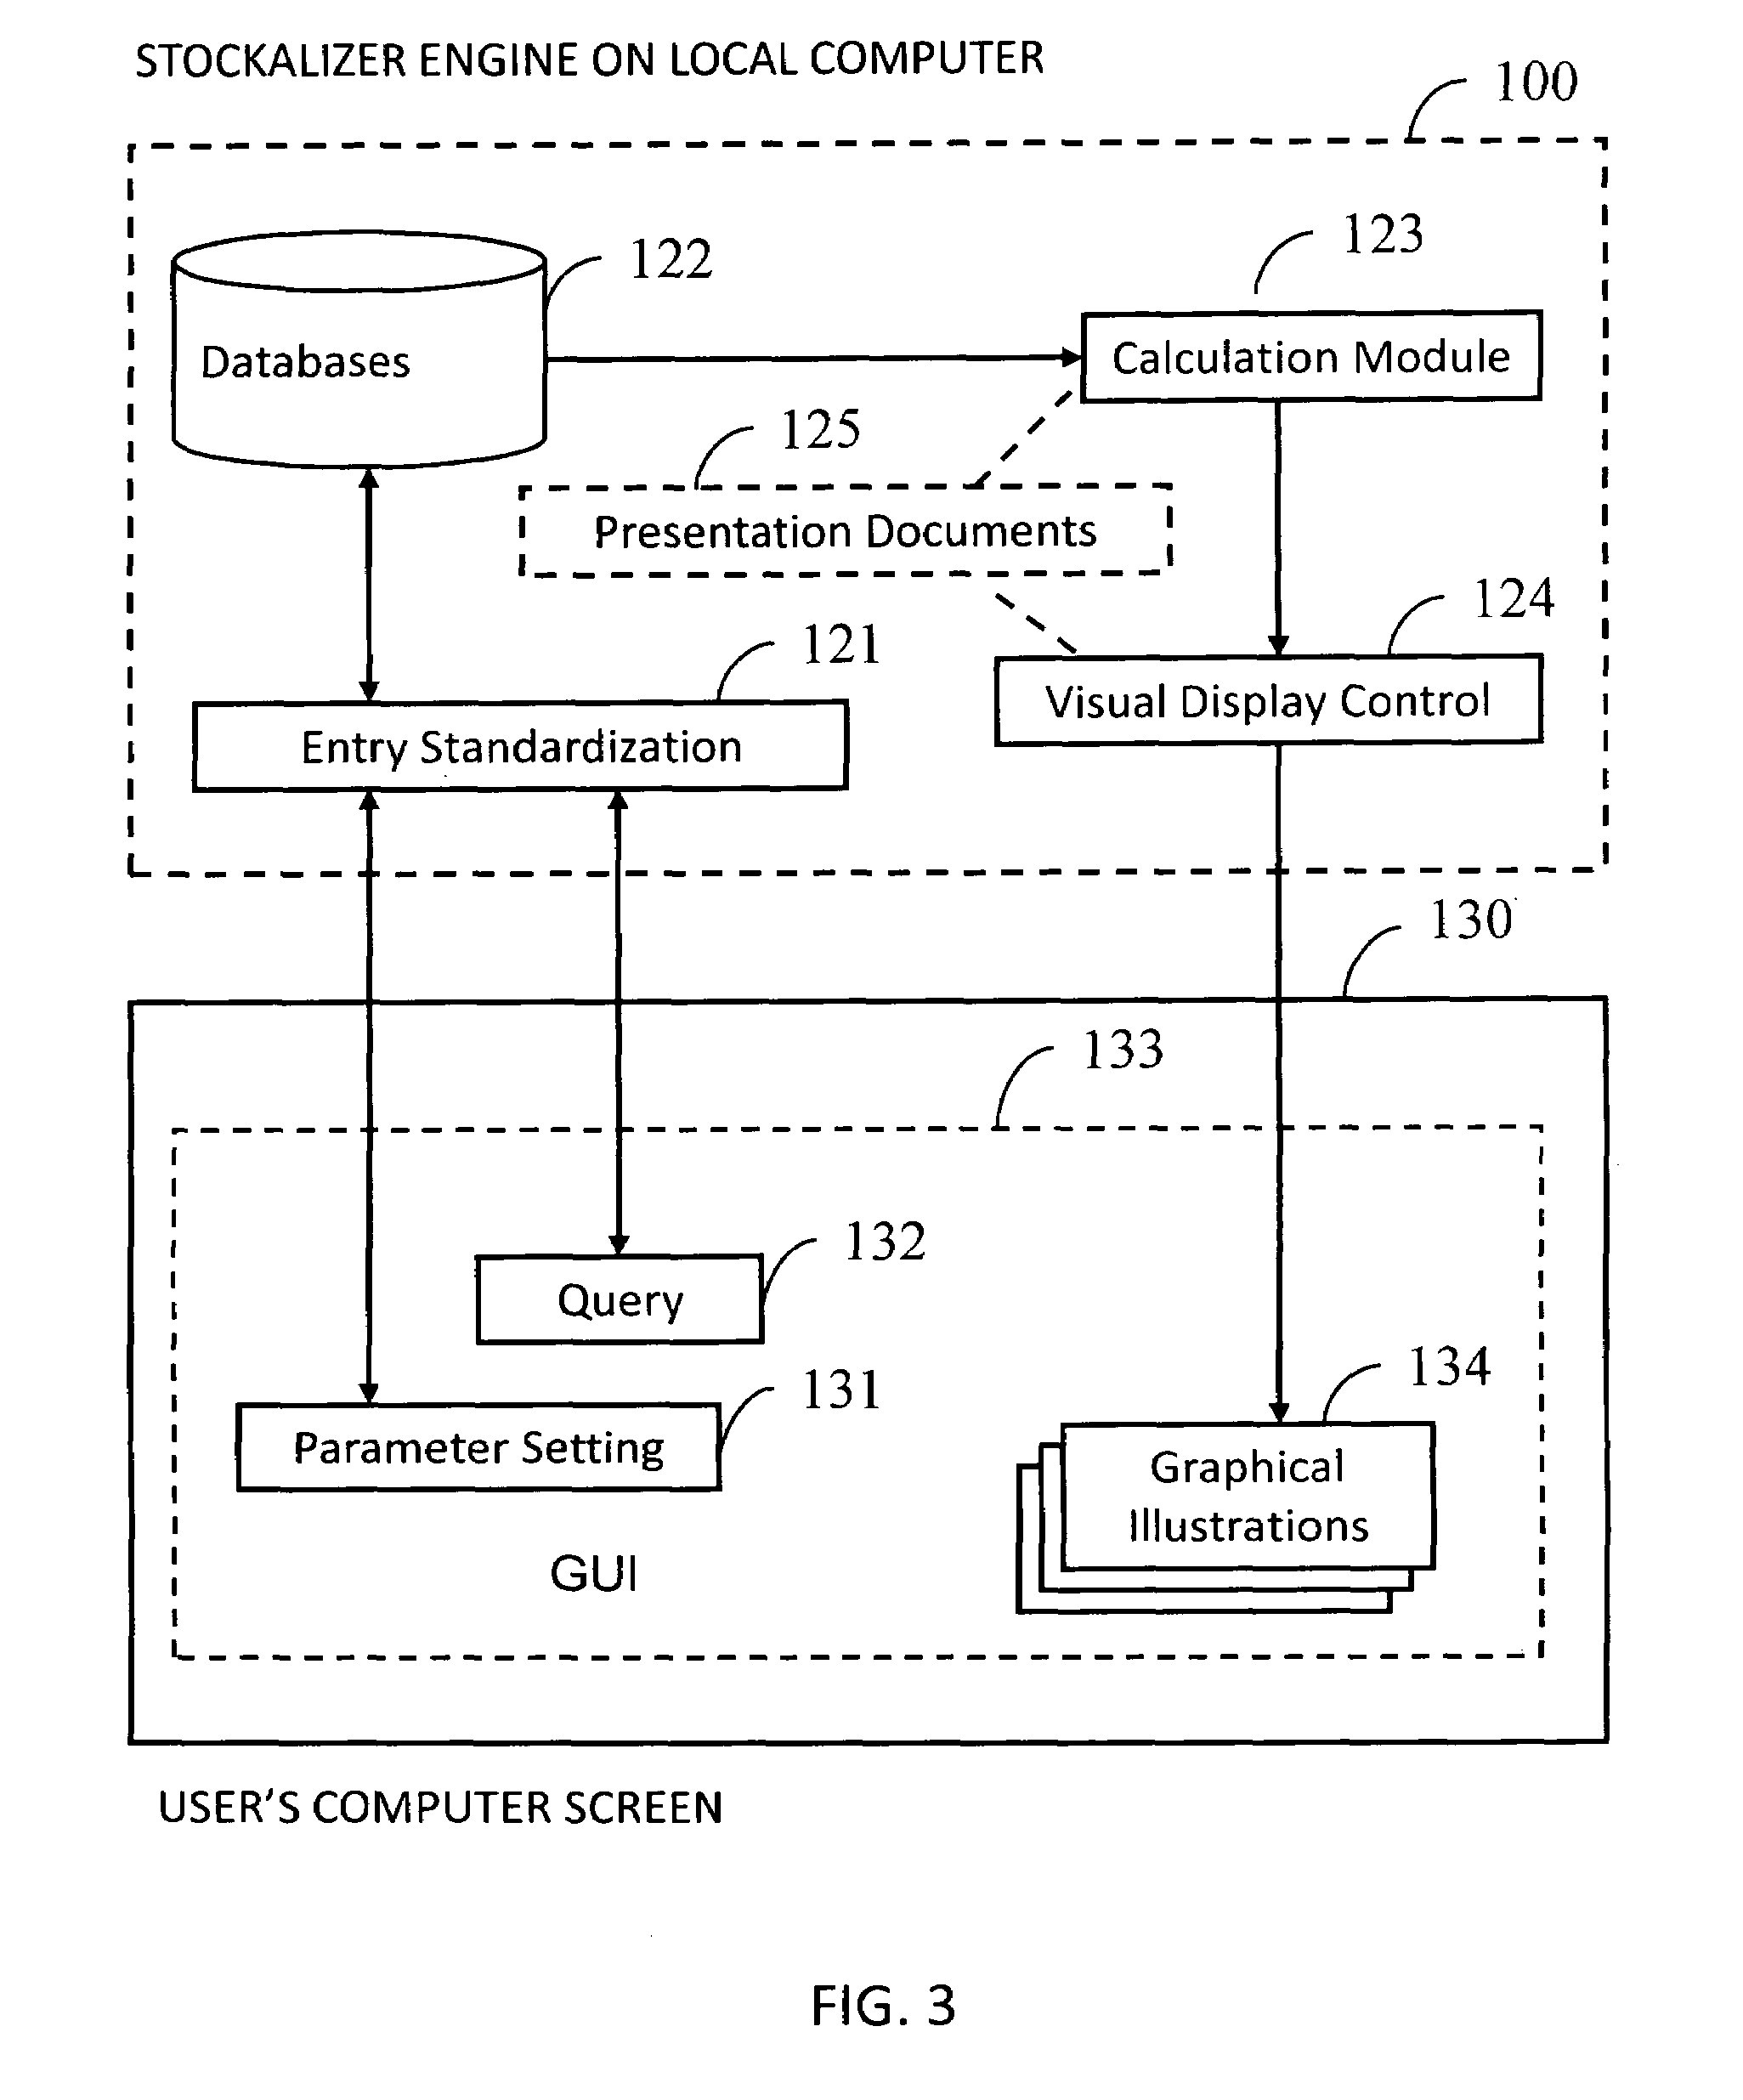
[0061]This invention provides a system and method of illustration which enable investors to easily visualize and compare the relationship of stock price movement and the underlying progression of fundamental operating variables of companies listed on exchanges around the world. For the purpose of the invention, a software system has been developed using new algorithms to derive custom data and phased array of financial database information, to calculate and solve financial data phasing and scaling issues, and to present pattern recognition graphic illustration formats which are specifically designed to create a new level of intuitive securities analysis. The central application of the software system, called the Change Point Analytics Stockalizer Program (herein after as Stockalizer Engine), is designed to assist investors in their self-education at much higher information levels and substantially faster recognition times than has been previously possible. The Stockalizer Engine all...


PUM


Abstract

The present invention provides a system and method for calculating and arraying an entirely universe of publicly traded stock performance data, technical and dynamic range of movement stock price data, underlying operating corporate balance sheet plus income statement fundamental data and ratios, and derived corporate operating and stock analysis data in such a manner as to enable the data for any selected single company to be phased, combined and superimposed within a series of graphical illustrations, which enable investors to easily visualize and compare the relationship of stock price movement and the underlying progression of fundamental operating variables of companies listed on exchanges around the world. The system includes a server computer, one or more client computer coupled to the server computer via the Internet, a database for storing, identifying and extrapolating stocks data, one module for calculating a set of selected performance parameters pursuant to a set of preset standards, a module for transforming calculation results of said calculation module into graphical illustrations; and a graphical user interface from which a user may send an inquiry to the server computer and be returned with a set of graphical illustrations on the inquired stock performance.

Description

REFERENCE TO RELATED APPLICATION[0001]The present application claims benefit of prior filed provisional Appl. Ser. No. 60 / 937,663 filed on Jun. 29, 2007, the entire content of which is hereby incorporated by reference.COPYRIGHT NOTICE[0002]Contained herein is material that is subject to copyright protection. The copyright owner has no objection to the facsimile reproduction of the patent disclosure by any person as it appears in the U.S. Patent and Trademark Office patent files or records, but otherwise reserves all rights to the copyright whatsoever.FIELD OF THE INVENTION[0003]The present invention relates in general to a phased array securities analysis graphic visualization system, and more particularly, to a computer application and method of creation of a new genre of pattern recognition stock market performance analysis graphs.BACKGROUND OF THE INVENTION[0004]The ability to visualize and correlate stock price movement, fundamental fair market value characteristics and emerging...

Claims


Application Information

Patent Timeline
IPC IPC(8): G06Q40/00
CPCG06Q40/06G06Q40/04
Inventor CROWDER, WILLIAM RORY
Owner CHANGE POINT ANALYTICS
Why Eureka
Try Eureka