Method and System for Data Analysis

a data analysis and data technology, applied in the field of data analysis methods and systems, can solve the problems of difficult to keep track of such corrections and ensure that they remain in place, disadvantageous manual cleaning and restructure of data, and limited capabilities, etc., to facilitate the operation of these operations

Active Publication Date: 2009-11-05
DRINKING BIRD SOFTWARE
View PDF19 Cites 101 Cited by
  • Summary
  • Abstract
  • Description
  • Claims
  • Application Information

AI Technical Summary

Benefits of technology

[0018]According to one aspect, there is provided a data analysis method and system that allows a plurality of operations to be performed automatically by understanding and analyzing the underlying data to be manipulated. In one aspect one or more of the following operations is provided: combining separate data together (e.g. by joining or appending); normalizing (i.e. summarizing) data; copying data; calculating new information from existing data; making corrections; and analyzing the data. Advantageously, the method and system allows users to work with their data at a high level using a small set of functions that facilitate performing these operations in a simple, generally intuitive way.
[0019]According to one embodiment, the method and system provides these functions in a manner that is persistent. That is, the method and system retains the information describing the operations performed, so that the operations need only be performed once and applies to a set of associated data. According to another embodiment, the operations are also dynamic, meaning that if any changes or corrections are made to any data within the system (e.g. to the input data table or to the source table), all other data within the system will correspondingly reflect the change. Finally, the operations are transparent, meaning that a user is clearly informed with regard to all operations which have been performed.
[0020]According to one aspect, the method and system allows a user to add, modify or delete any data. In one aspect, all such modifications are marked as corrections within the corresponding table. Accordingly, information regarding the original (uncorrected) state of the data is always available to the user. In one aspect, the corrections made by a user to the data are reversible, so the user can easily revert back to the original state of the data.
[0021]Advantageously, the data analysis system is tolerant of errors in the data (e.g. dirty data). The functions provided (e.g. copy, summarize, append, join, analyze) operate in a manner that can produce meaningful results even with errors in the source data.

Problems solved by technology

The difficulties with dirty data are first to identify the implied relationships when the data is not clean, and then to correctly address the inconsistencies in the data.
This is disadvantageous since inconsistent “dirty” data tends to be the majority of cases, particularly with ad-hoc data sources.
Some analysis programs allow the user to make limited corrections to the data, but these capabilities are often limited in scope, and in general it is very difficult to keep track of such corrections and ensure that they remain in place as the user works with the data.
Therefore manually cleaning and restructuring the data is still often needed prior to performing any analysis or manipulation on the data.
As will be understood by a person skilled in the art, manual cleaning and restructuring of data is disadvantageous as it requires users to be knowledgeable of the desired result and clean data.
As well, when handling large amounts of dirty data, this process is tedious and unreliable.
Further, the difficulty with these existing methods is that spreadsheet programs and database programs are extremely low-level tools designed for flexibility, not simplicity.
This process is time consuming, non-intuitive and error-prone.
As a result, data manipulation in spreadsheet and database programs involves significant numbers of sequential manual steps to be performed.
These systems also generally require significant involvement of technical personnel to set up and maintain.
However, the data often needs to be transformed, corrected or otherwise manipulated by the user before it can be usefully analyzed in these software packages.
This process is time consuming, non-intuitive and error-prone.
Thus, users generally spend the majority of their time performing repetitive operations.
First, as previously noted, the tools involved are very low-level, so users often must perform multiple low-level operations to effectively perform a single high-level operation.
Secondly, the tools involved are not dynamic, meaning that the tools often cannot be set up to dynamically perform all the necessary processing from beginning to end; instead the user generally performs a series of steps, with the output of each step being then used as input to the next step.
If any errors are made at any step and discovered later, the user must repeat all the steps subsequent to the error; often, the intermediate results are no longer available at this point and the user must start again at the very beginning.
Such errors happen frequently even with experienced users, due to the complexity of the process.
On the other hand, a desktop database is not dynamic (such operations must be performed sequentially, and if the input changes, the results of the join do not fully reflect the changes); additionally, a desktop database handles errors in the data very poorly, generally disallowing certain operations until the user has manually found and corrected each error.
Thus, spreadsheets and desktop databases used to analyze and report on data, require performing the same steps repeatedly in a very time-consuming and error-prone manner.
Further, users typically spend much more of their time manipulating data, as opposed to actually analyzing the information.

Method used


Image

  • Method and System for Data Analysis
  • Method and System for Data Analysis
  • Method and System for Data Analysis

Examples


Embodiment Construction

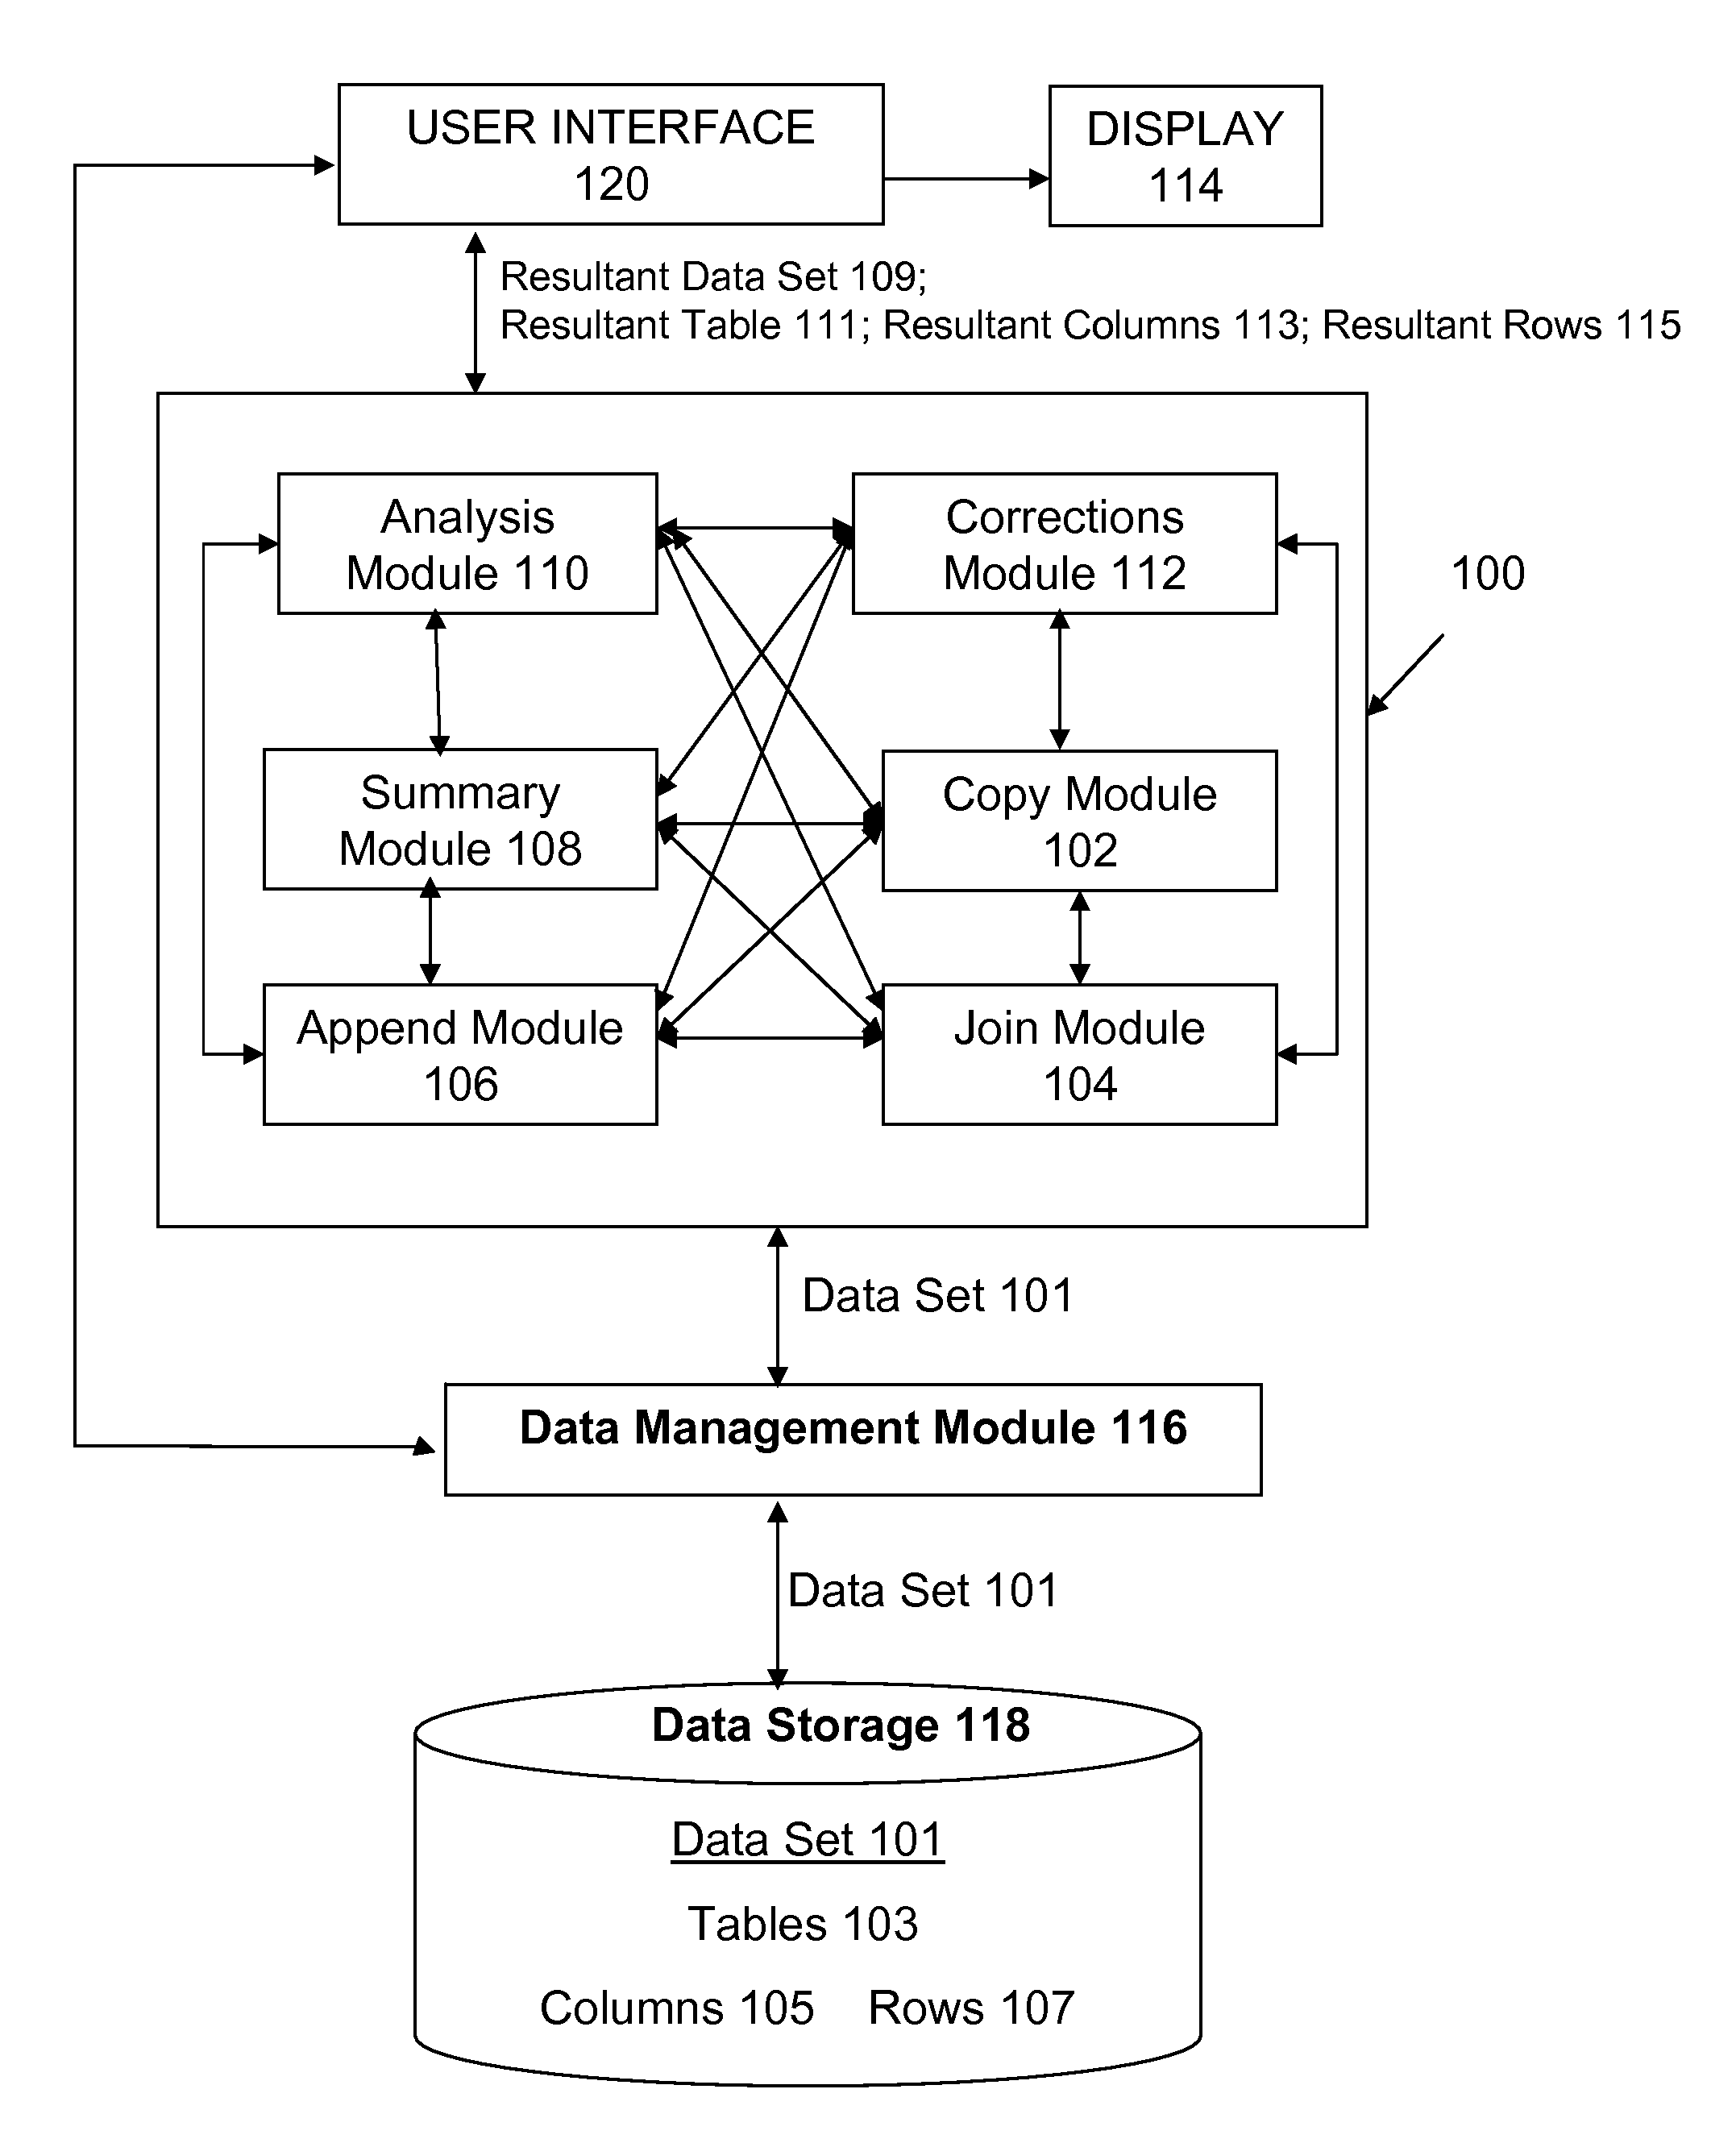
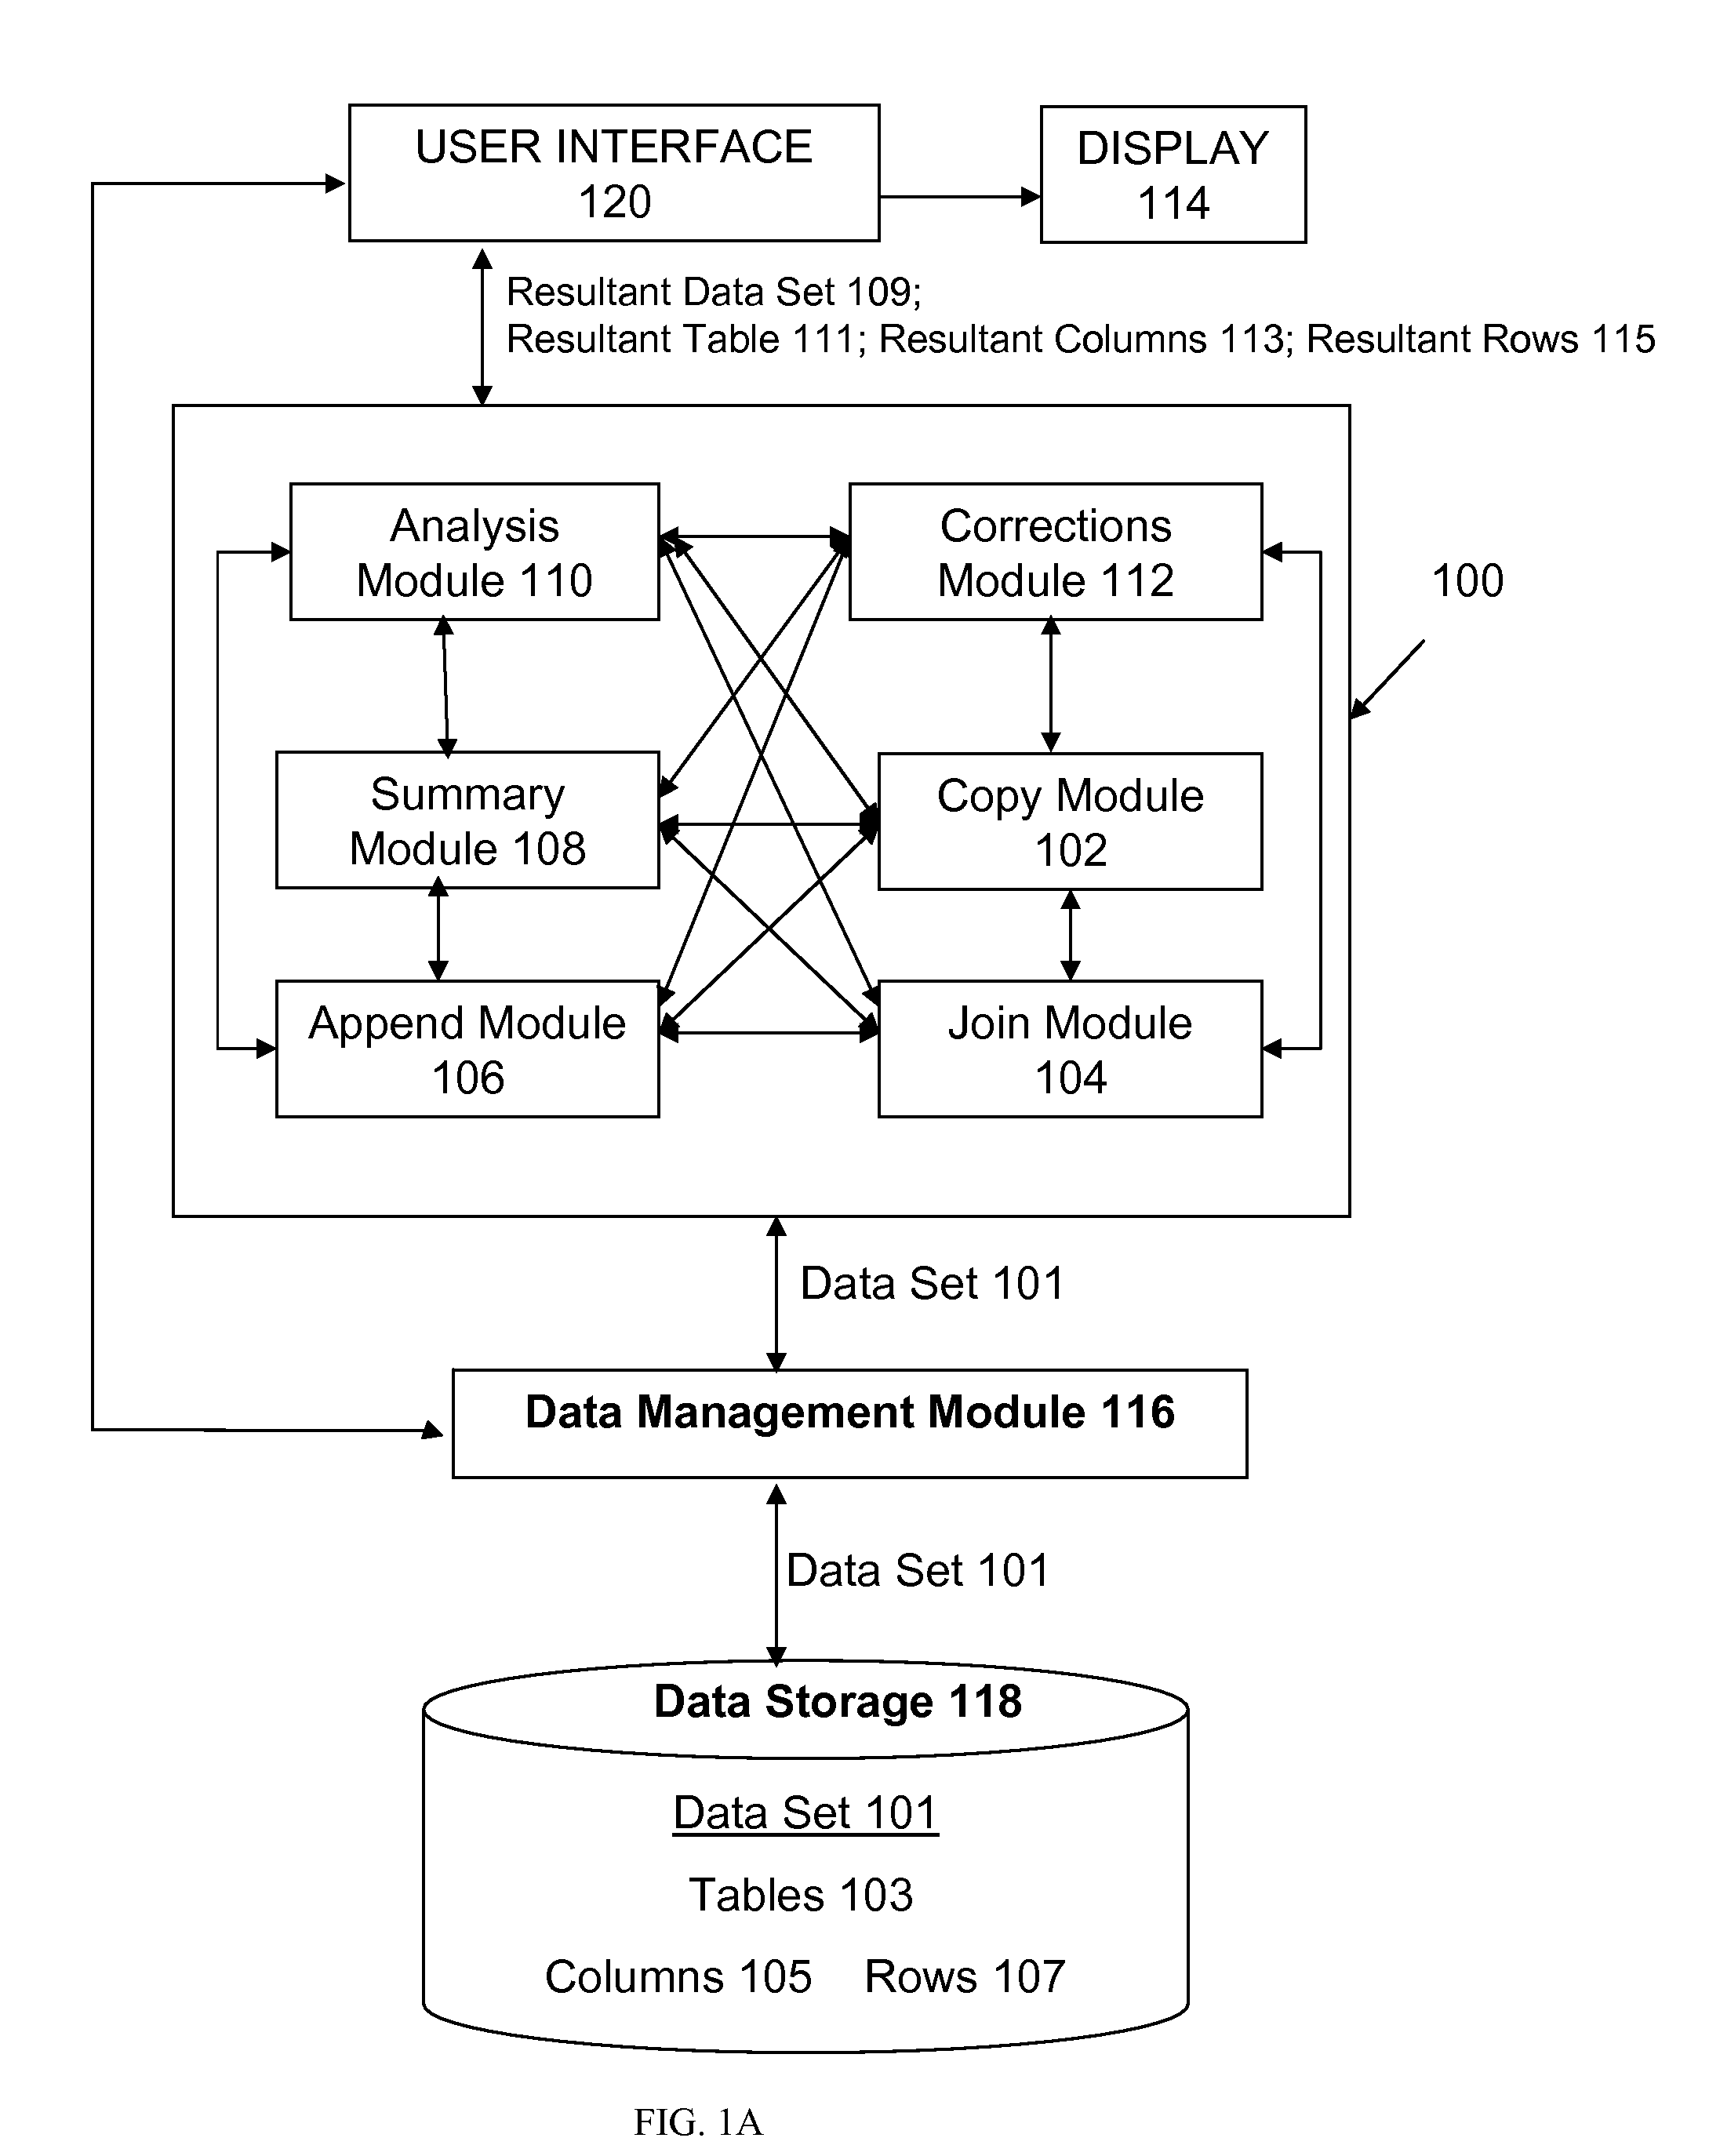
Data Analysis System 100

[0052]For convenience, like reference numerals in the description refer to like structures in the drawings. Referring to FIG. 1A, shown is an embodiment of a data analysis system, indicated generally by the numeral 100. The data analysis system 100 is configured for facilitating restructuring of data such as joining rows from different tables, cleaning of data such as to remove discrepancies and redundancies with the data, correction such as allowing a user to correct data while keeping track of corrections, and analysis of data such as to provide graphical analysis. As described earlier, the data received by the data analysis system 100 may receive dirty data that includes redundancies and other discrepancies within the data. The data analysis system 100 receives a data set 101 from a data management module 116. The data management module 116 interacts with and receives the data set 101 from a data storage 118 for subsequent manipulation by the data analysis...


PUM


Abstract

A data analysis and display system and method for performing a plurality of operations on data arranged in data tables. One or more of the following data operations are provided: combining separate data together, for example by joining and appending; normalizing and summarizing; copying; calculating and presenting new information from existing data; making corrections in a persistent manner, and analyzing the data, to allow users to work with their data at a high level using a core set of functions that facilitate performance of these operations in a generally simple, intuitive manner.

Description

RELATED APPLICATION[0001]This application claims benefit of priority to Provisional U.S. Patent Application No. 61 / 050,291, filed May 5, 2008, entitled Method and System for Data Analysis; the aforementioned priority application being hereby incorporated by reference in its entirety.FIELD OF THE INVENTION[0002]The present invention relates to a method and system for data analysis and specifically, a method and system for facilitating restructuring, manipulation and analysis of data.BACKGROUND OF THE INVENTION[0003]A large number of human endeavours use quantitative data methods to track and control activities. As a result, a large number of computer programs are available today for analyzing data. However, these programs are designed to work with clean (e.g. , well-structured data).[0004]Generally, clean data can be defined as data that is fully consistent with any implied relationships within the data. An implied relationship arises due to real-world relationships between objects r...

Claims


Application Information

Patent Timeline
Patent Type & Authority Applications(United States)
IPC IPC(8): G06F3/02
CPCG06F17/30498G06F17/245G06F17/30539G06F16/2456G06F16/2465G06F40/177
Inventor ROSNER, NORM
Owner DRINKING BIRD SOFTWARE
Why Eureka
Try Eureka