Method for recovering heavy/viscous oils from a subterranean formation
- Summary
- Abstract
- Description
- Claims
- Application Information
AI Technical Summary
Benefits of technology
Problems solved by technology
Method used
Image
Examples
example 1
Effect of the Amount of Primary Production (% OIP)
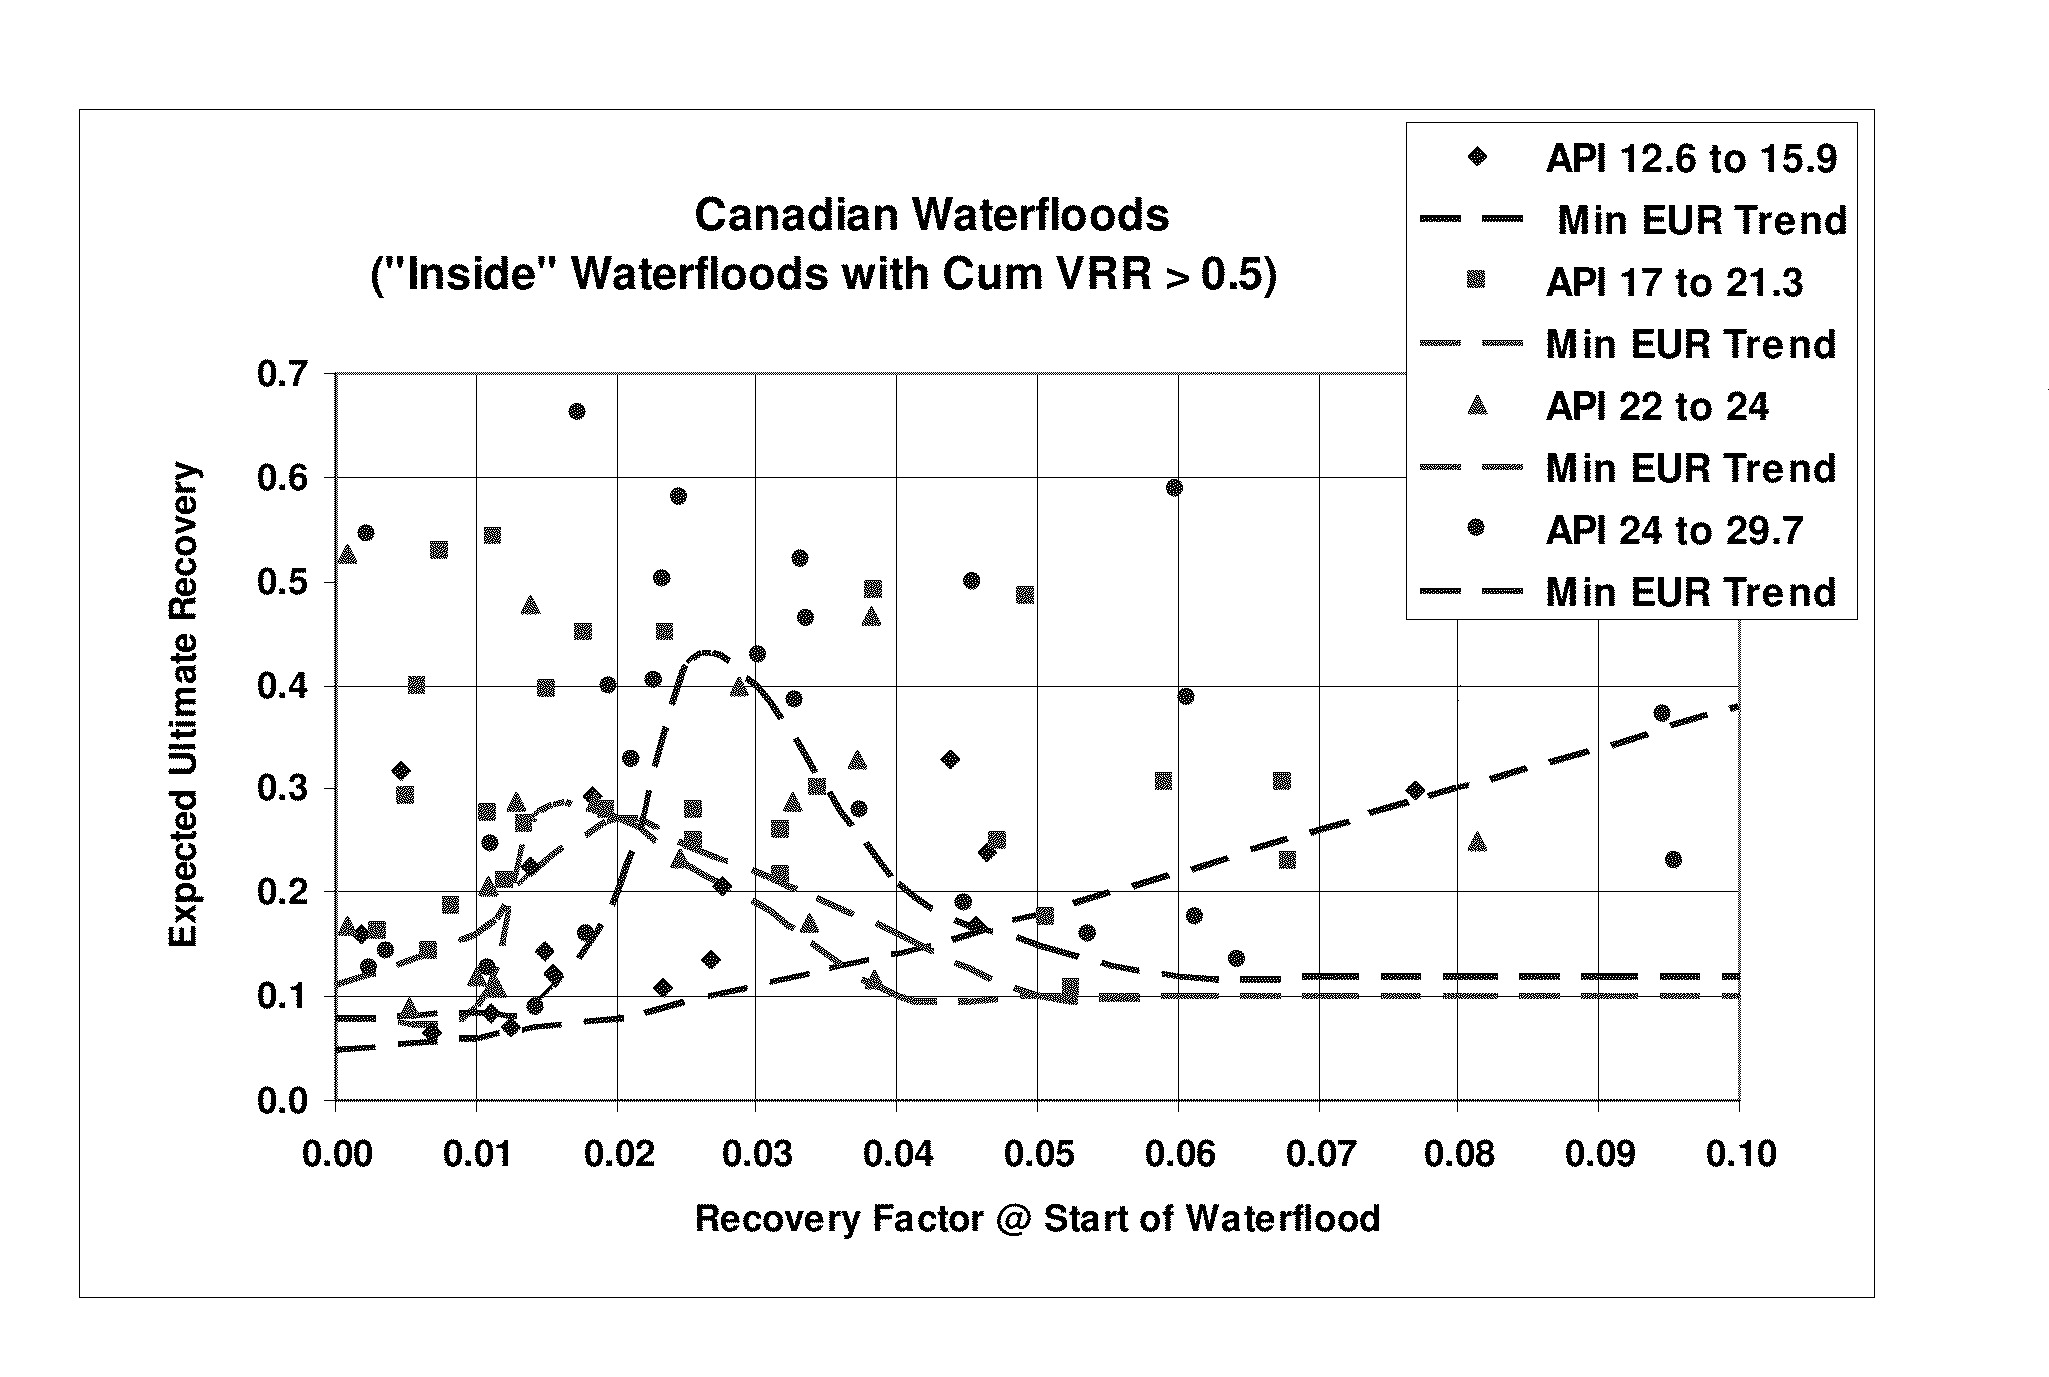
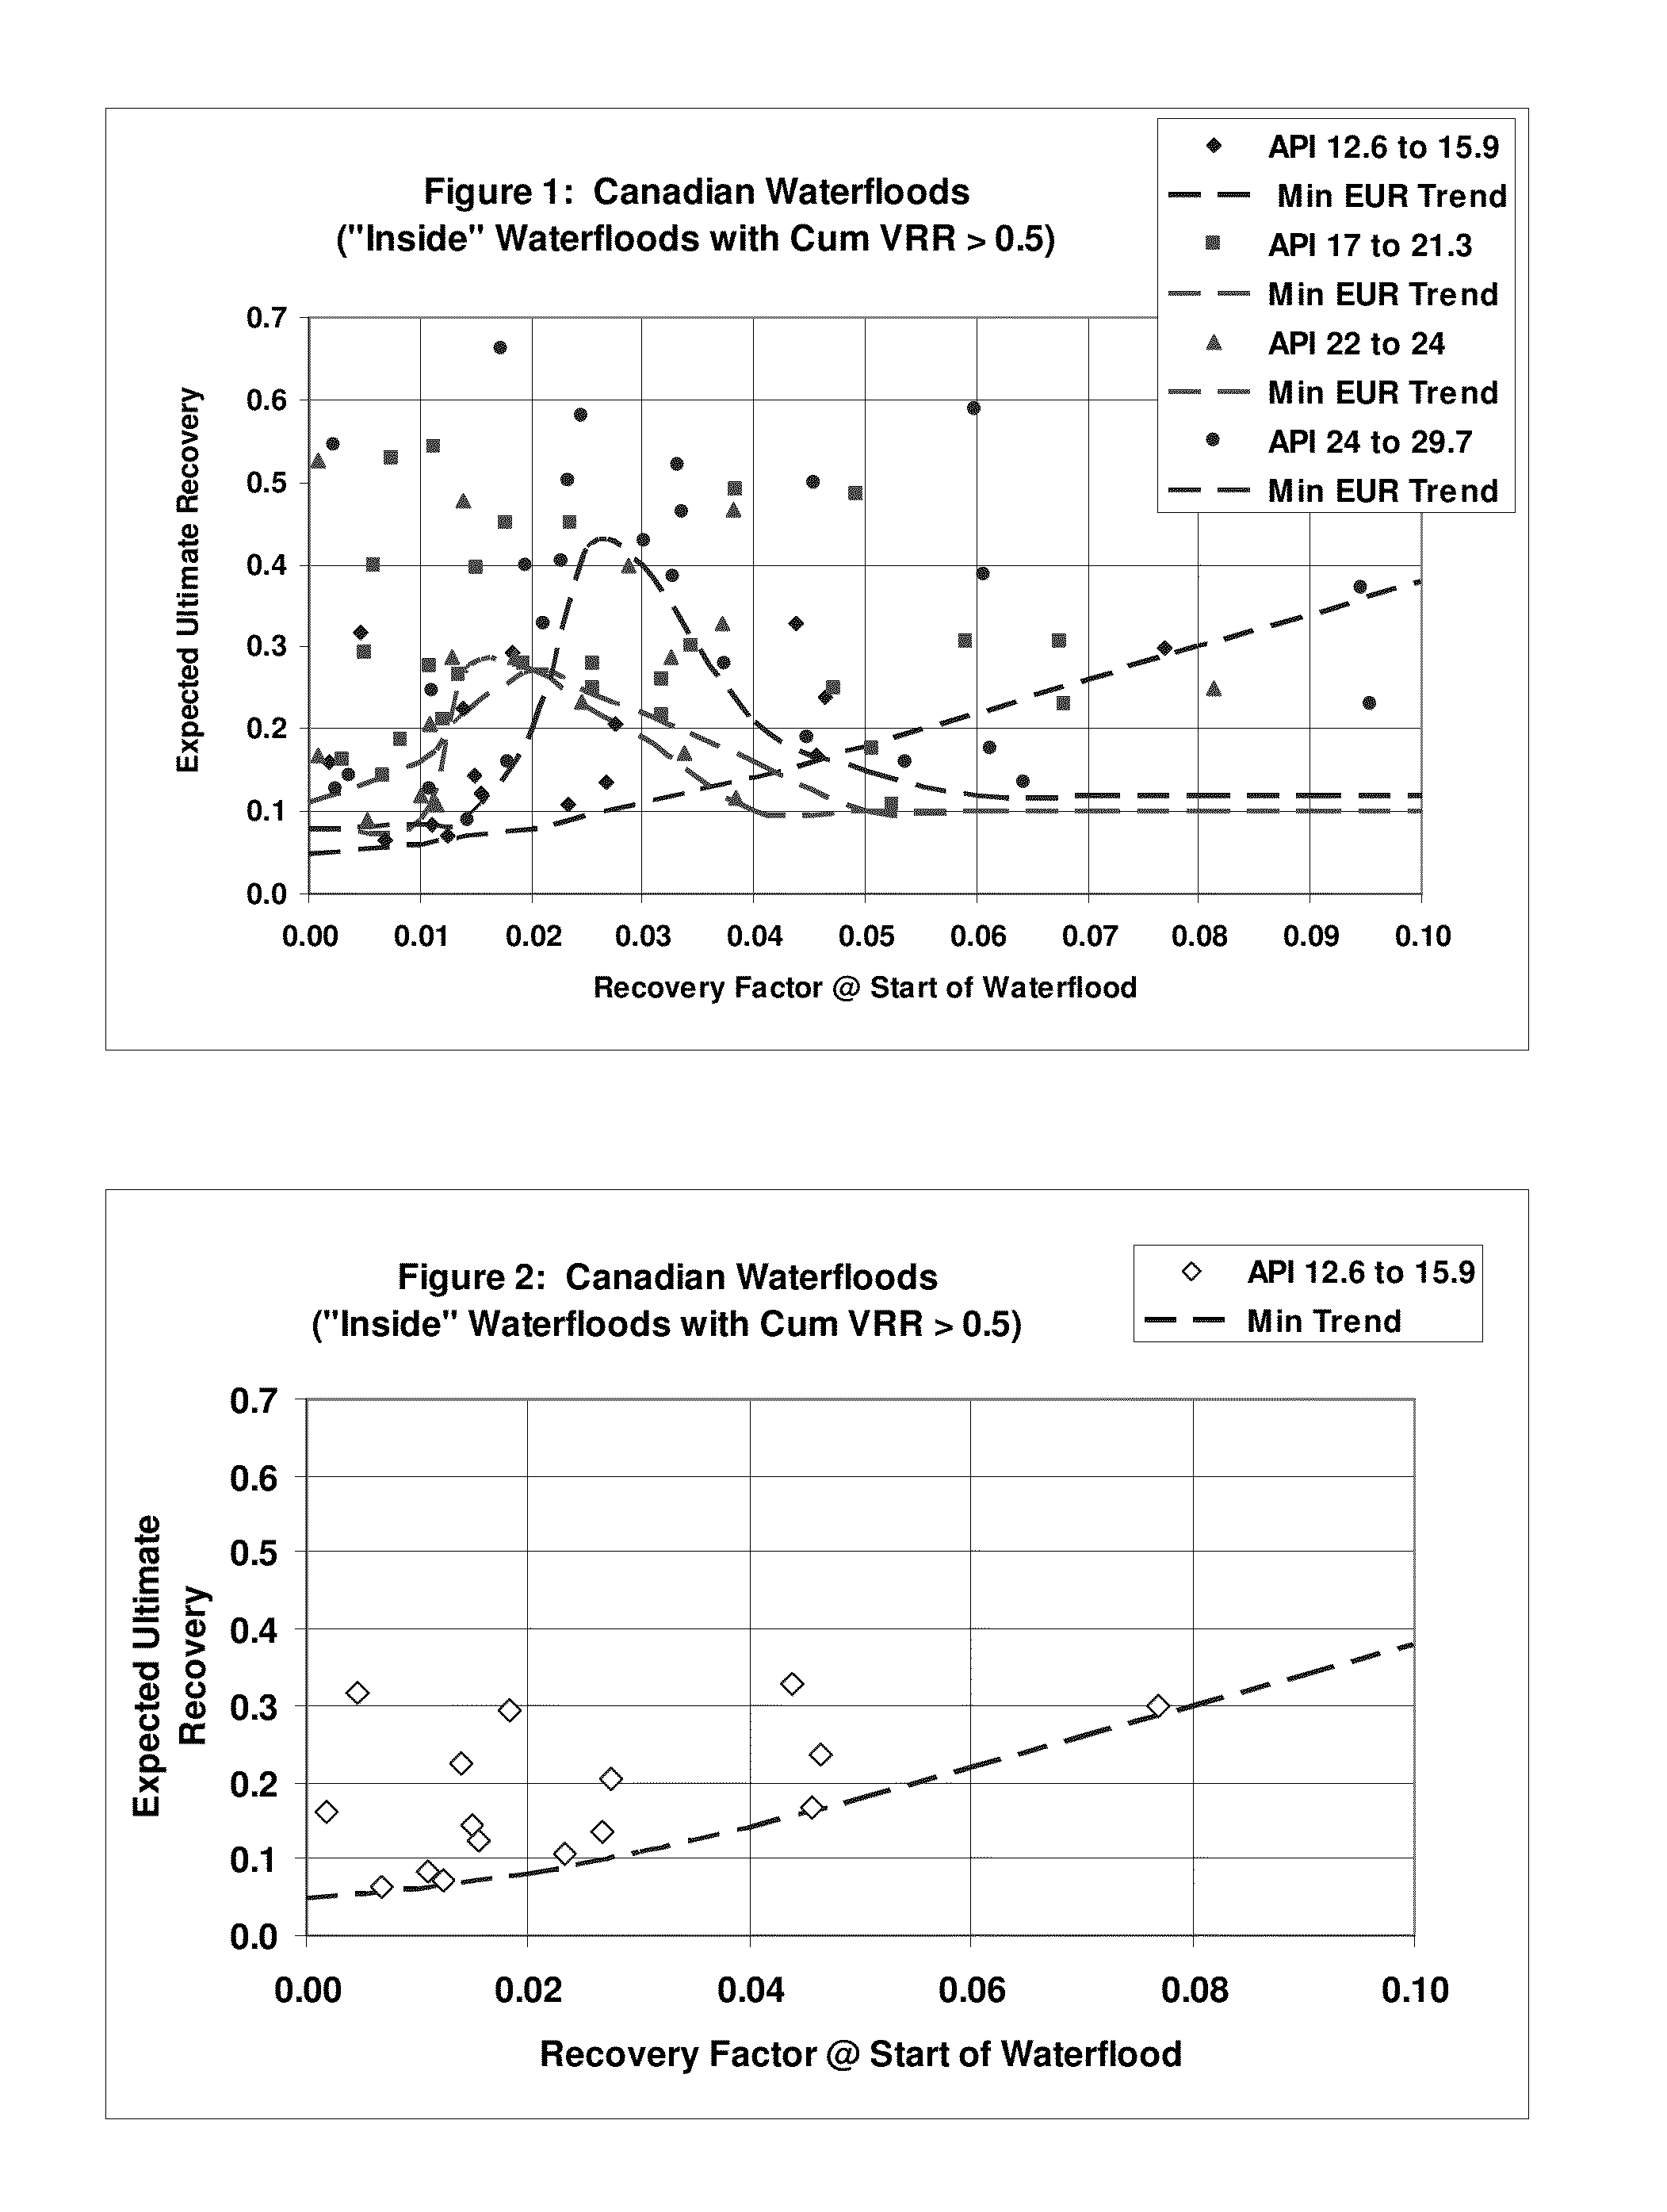
[0087]FIG. 1 shows the relationship between EUR and the amount of primary production, expressed as a fraction of OIP. Attention was directed firstly to 90 inside waterfloods.
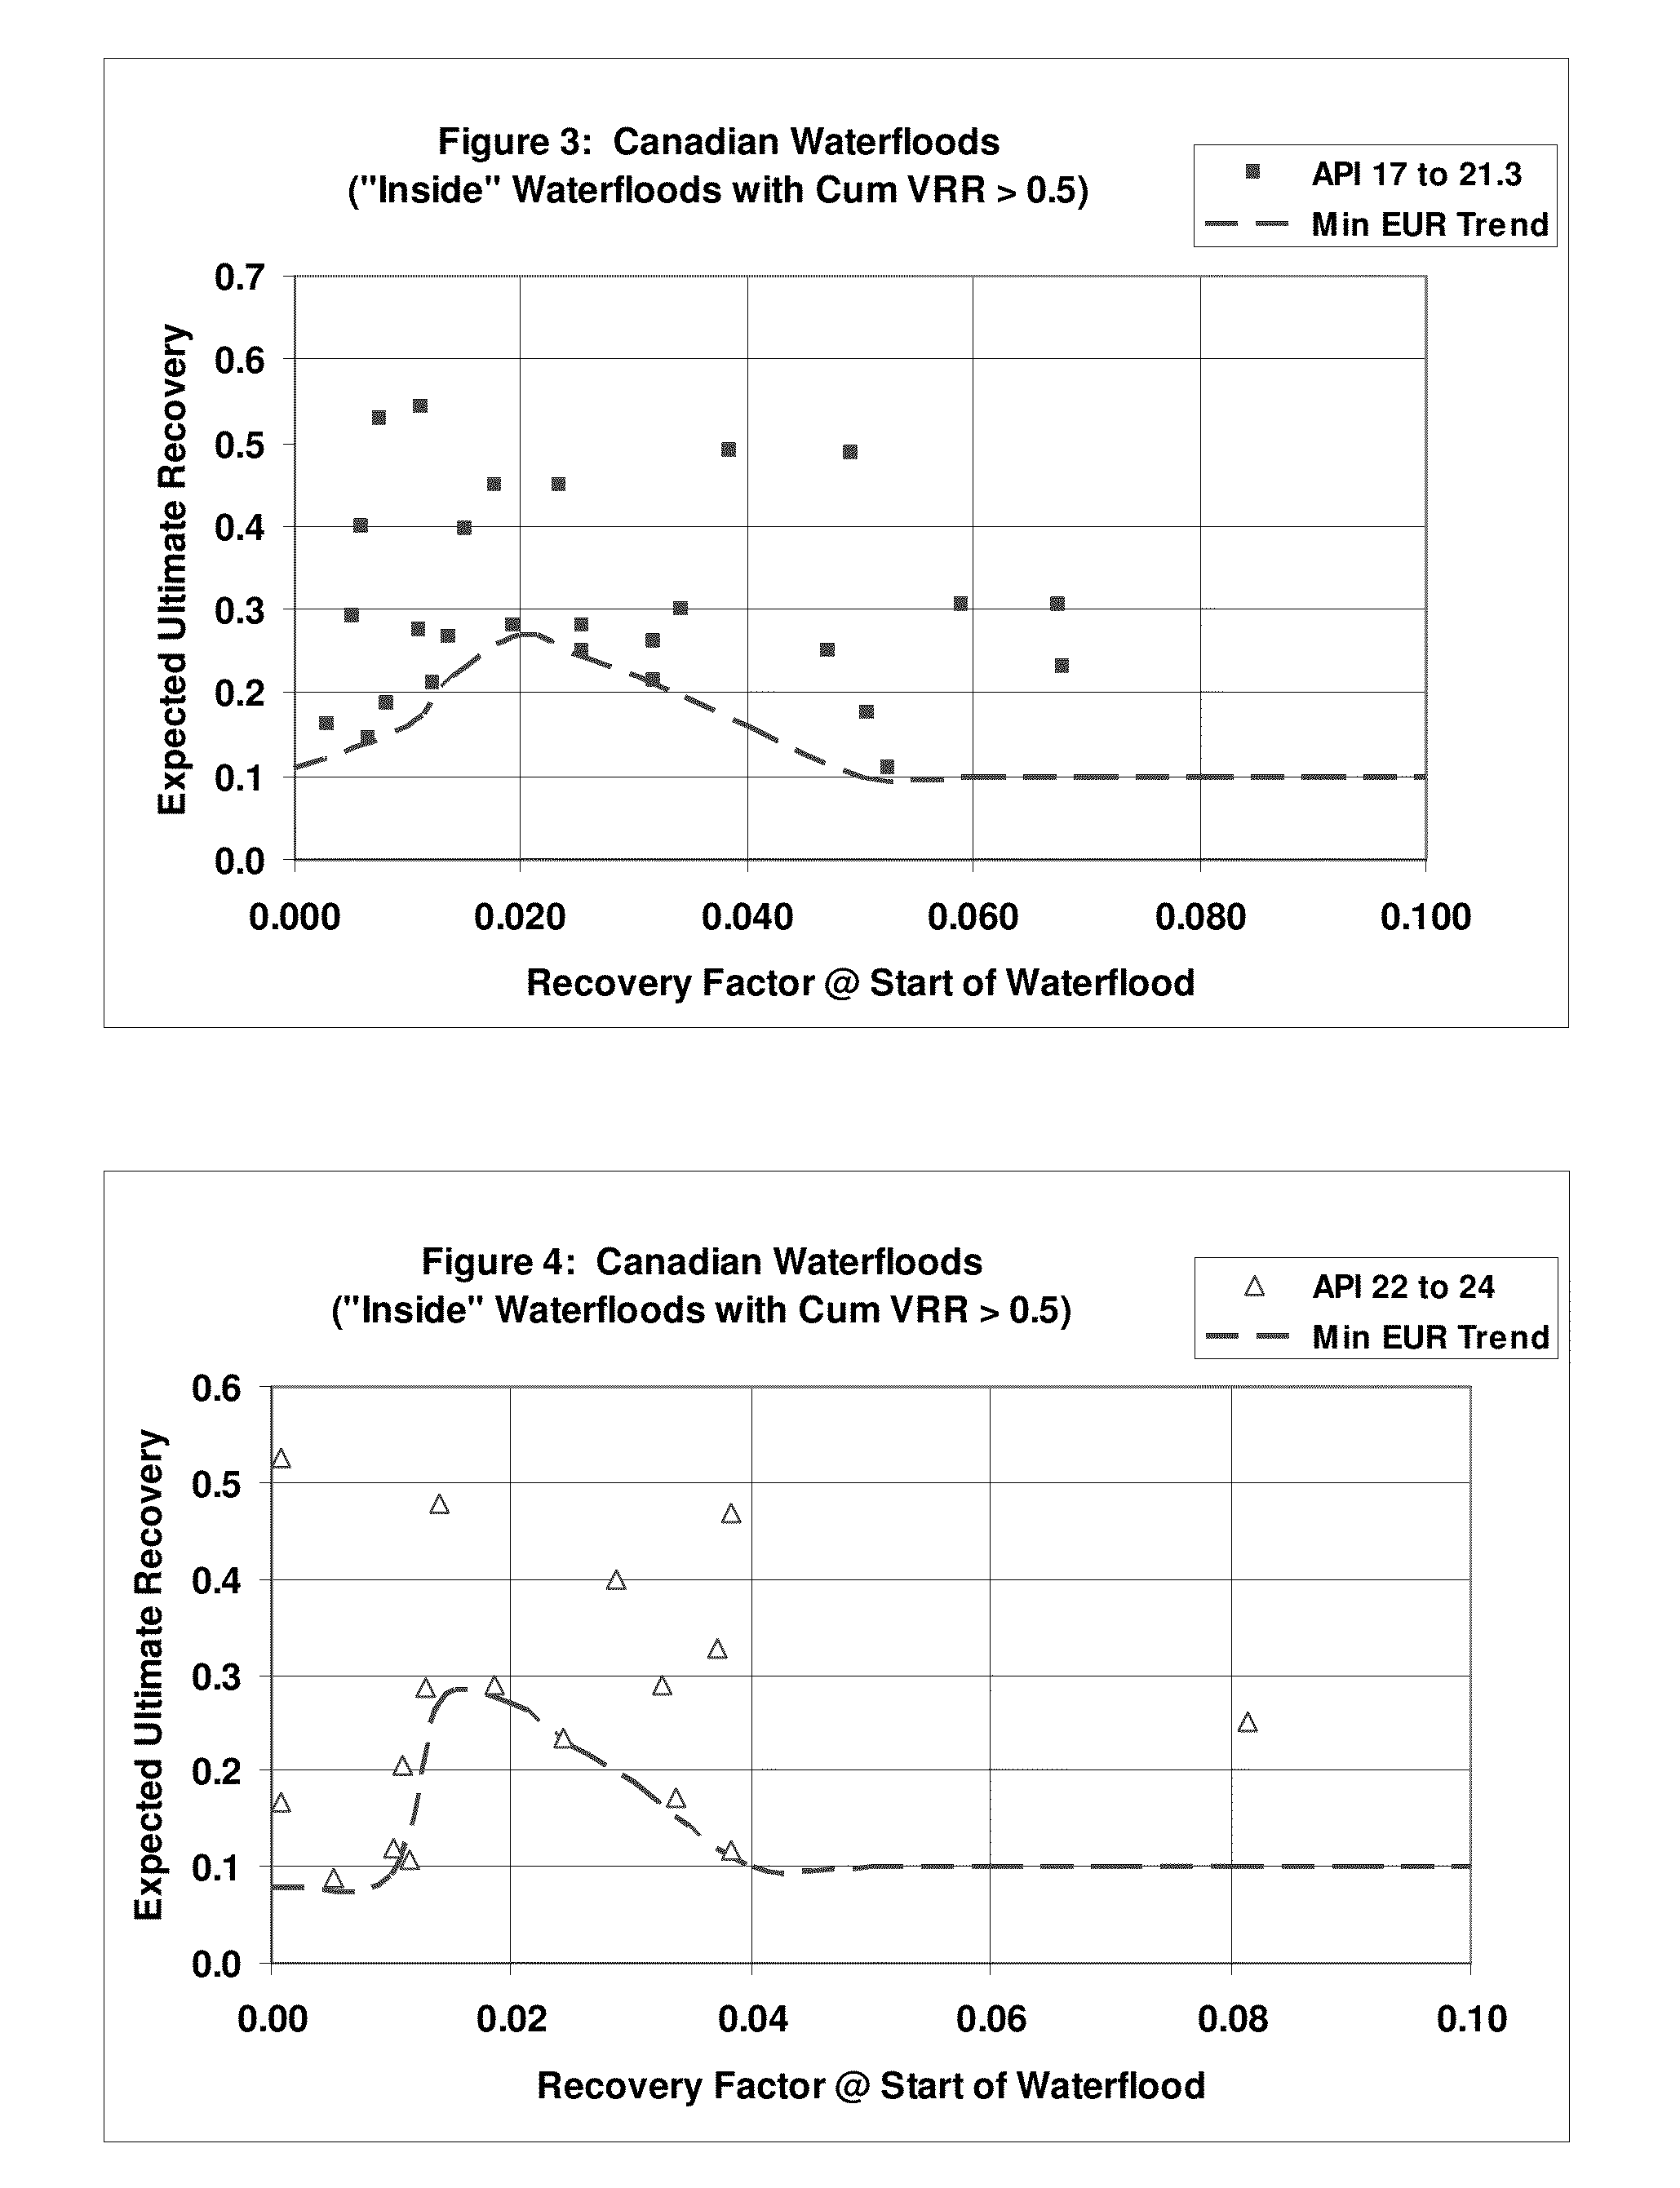
[0088]FIGS. 2 to 5 show subsets of the combined dataset of 90 inside waterfloods: these are, respectively, waterfloods producing oil <17° API; between 17 and 22° API; between 22 and 24° API; and between 24 and 30° API. Rather than drawing a least-squares best fit line or curve through the data points in each graph, attention was directed to the minimum EUR experienced for each data set. These minimum-trend curves manifest an interesting pattern. With the exception of the heaviest oil (<17° API) waterfloods in FIG. 2, the minimum-trend curves in FIGS. 3 to 5 each show a “sweet spot” where the minimum EUR increases to a maximum value. This generally occurs with a pre waterflood production of from about 1 to 5% of the OIP, and more distinctly from 1.5 to 2.5% of OIP...
example 2
Effect of Injection Volume (VRR)
[0090]FIG. 9 shows there is a correlation between the fraction of underinjection of the reservoir and the EUR. The x-axis parameter is the volume weighted injection fraction when the VRR is less than 0.95. FIG. 9 is a graph for the “Inside” Alaska-like (Canadian) waterfloods where the kh / μ is 1.4-100 mD-ft / cP. The sweet spot of increased minimum EUR's observed when the fraction of injection is less than 0.95 is similar to the sweet spot increases in the minimum EUR seen with the fraction of oil recovery prior to the initiation of waterflooding (FIGS. 1-7). In both cases there is an optimum sweet spot window of EUR. By investigating inside waterfloods and grouping the data by API, a sweet spot of an increase in the minimum EUR is observed. See FIG. 10 for <17° API and FIG. 11 for 17 to 23° API. FIG. 10 shows that even the heaviest oils (API gravity<17°) have an increase in the minimum EUR recovery trend curve when 30 to 50% of the injection occurs with...
example 3
Effect of Cumulative VRR
[0091]It is important to distinguish the recommendation of periods of underinjection from overall underinjection. FIG. 12 graphs the EUR vs. cumulative VRR for a variety of “inside” waterfloods. A cumulative VRR range of from 0.6 to 1.25 shows generally better EUR than waterfloods outside of this range, while a cumulative VRR of 0.93 to 1.11 shows significantly better EUR than waterfloods with cumulative VRR1.11. Thus, while this data from Example 2 suggests that periods of underinjection will benefit heavy oil waterfloods, the data from Example 3 suggests that the overall cumulative VRR needs to be balanced for optimum results. For example, a flood which has a fraction of underinjection volume of 20% would inject, say, 20,000 m3 of water at a VRR0.95, with the injection volume for the VRR>0.95 being sufficient to make the overall VRR˜1.0.
PUM
 Abstract
Description
Claims
Application Information
 - R&D
- Intellectual Property
- Life Sciences
- Materials
- Tech Scout
- Unparalleled Data Quality
- Higher Quality Content
- 60% Fewer Hallucinations
Browse by: Latest US Patents, China's latest patents, Technical Efficacy Thesaurus, Application Domain, Technology Topic, Popular Technical Reports.
© 2025 PatSnap. All rights reserved.Legal|Privacy policy|Modern Slavery Act Transparency Statement|Sitemap|About US| Contact US: help@patsnap.com


