

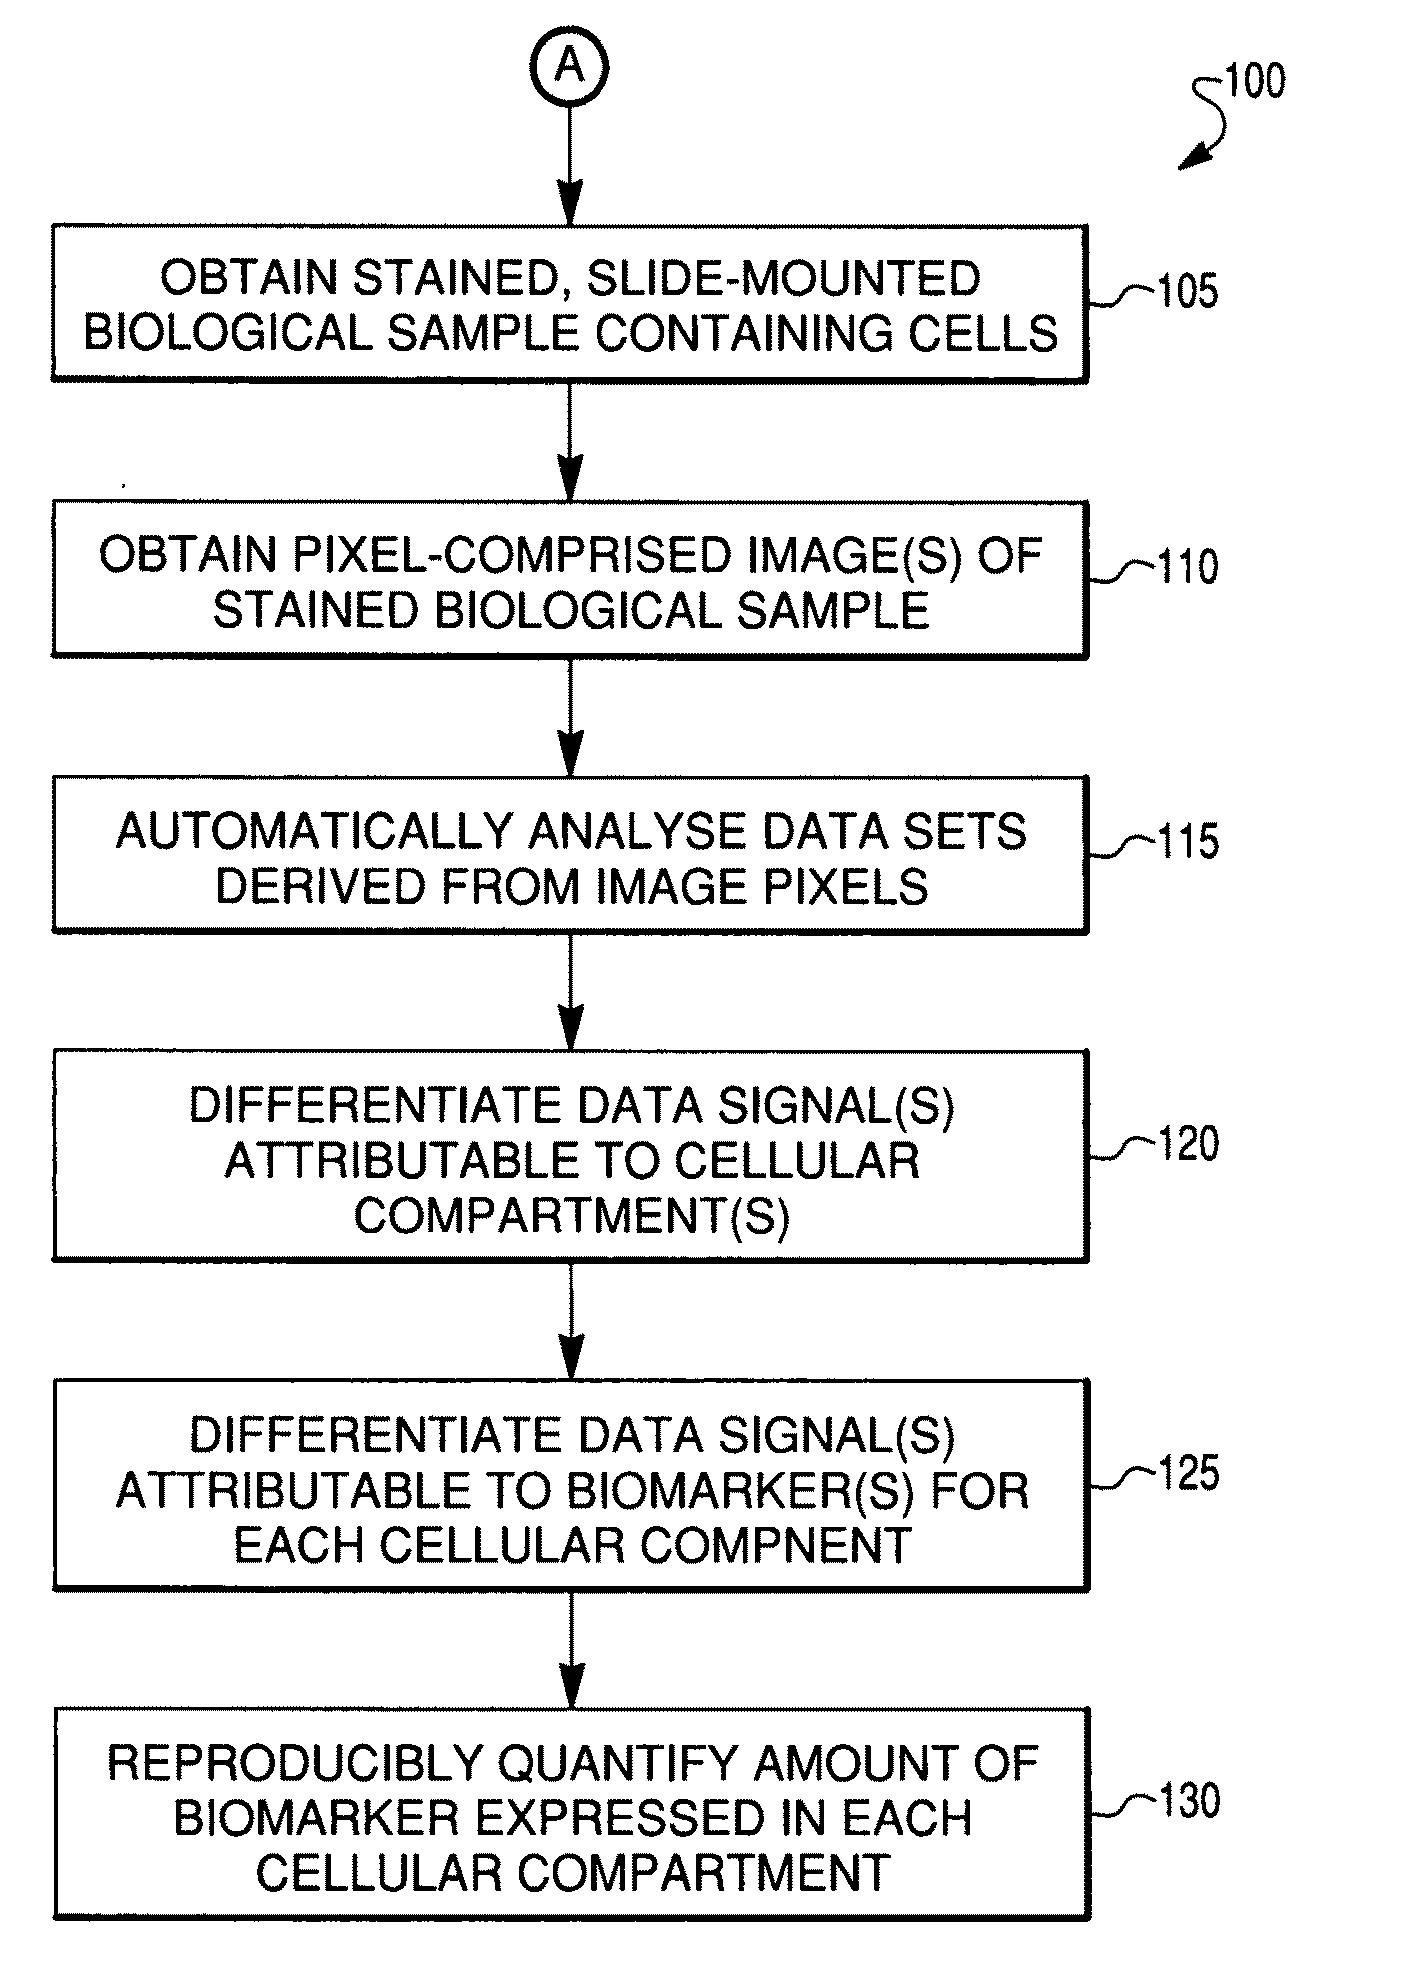
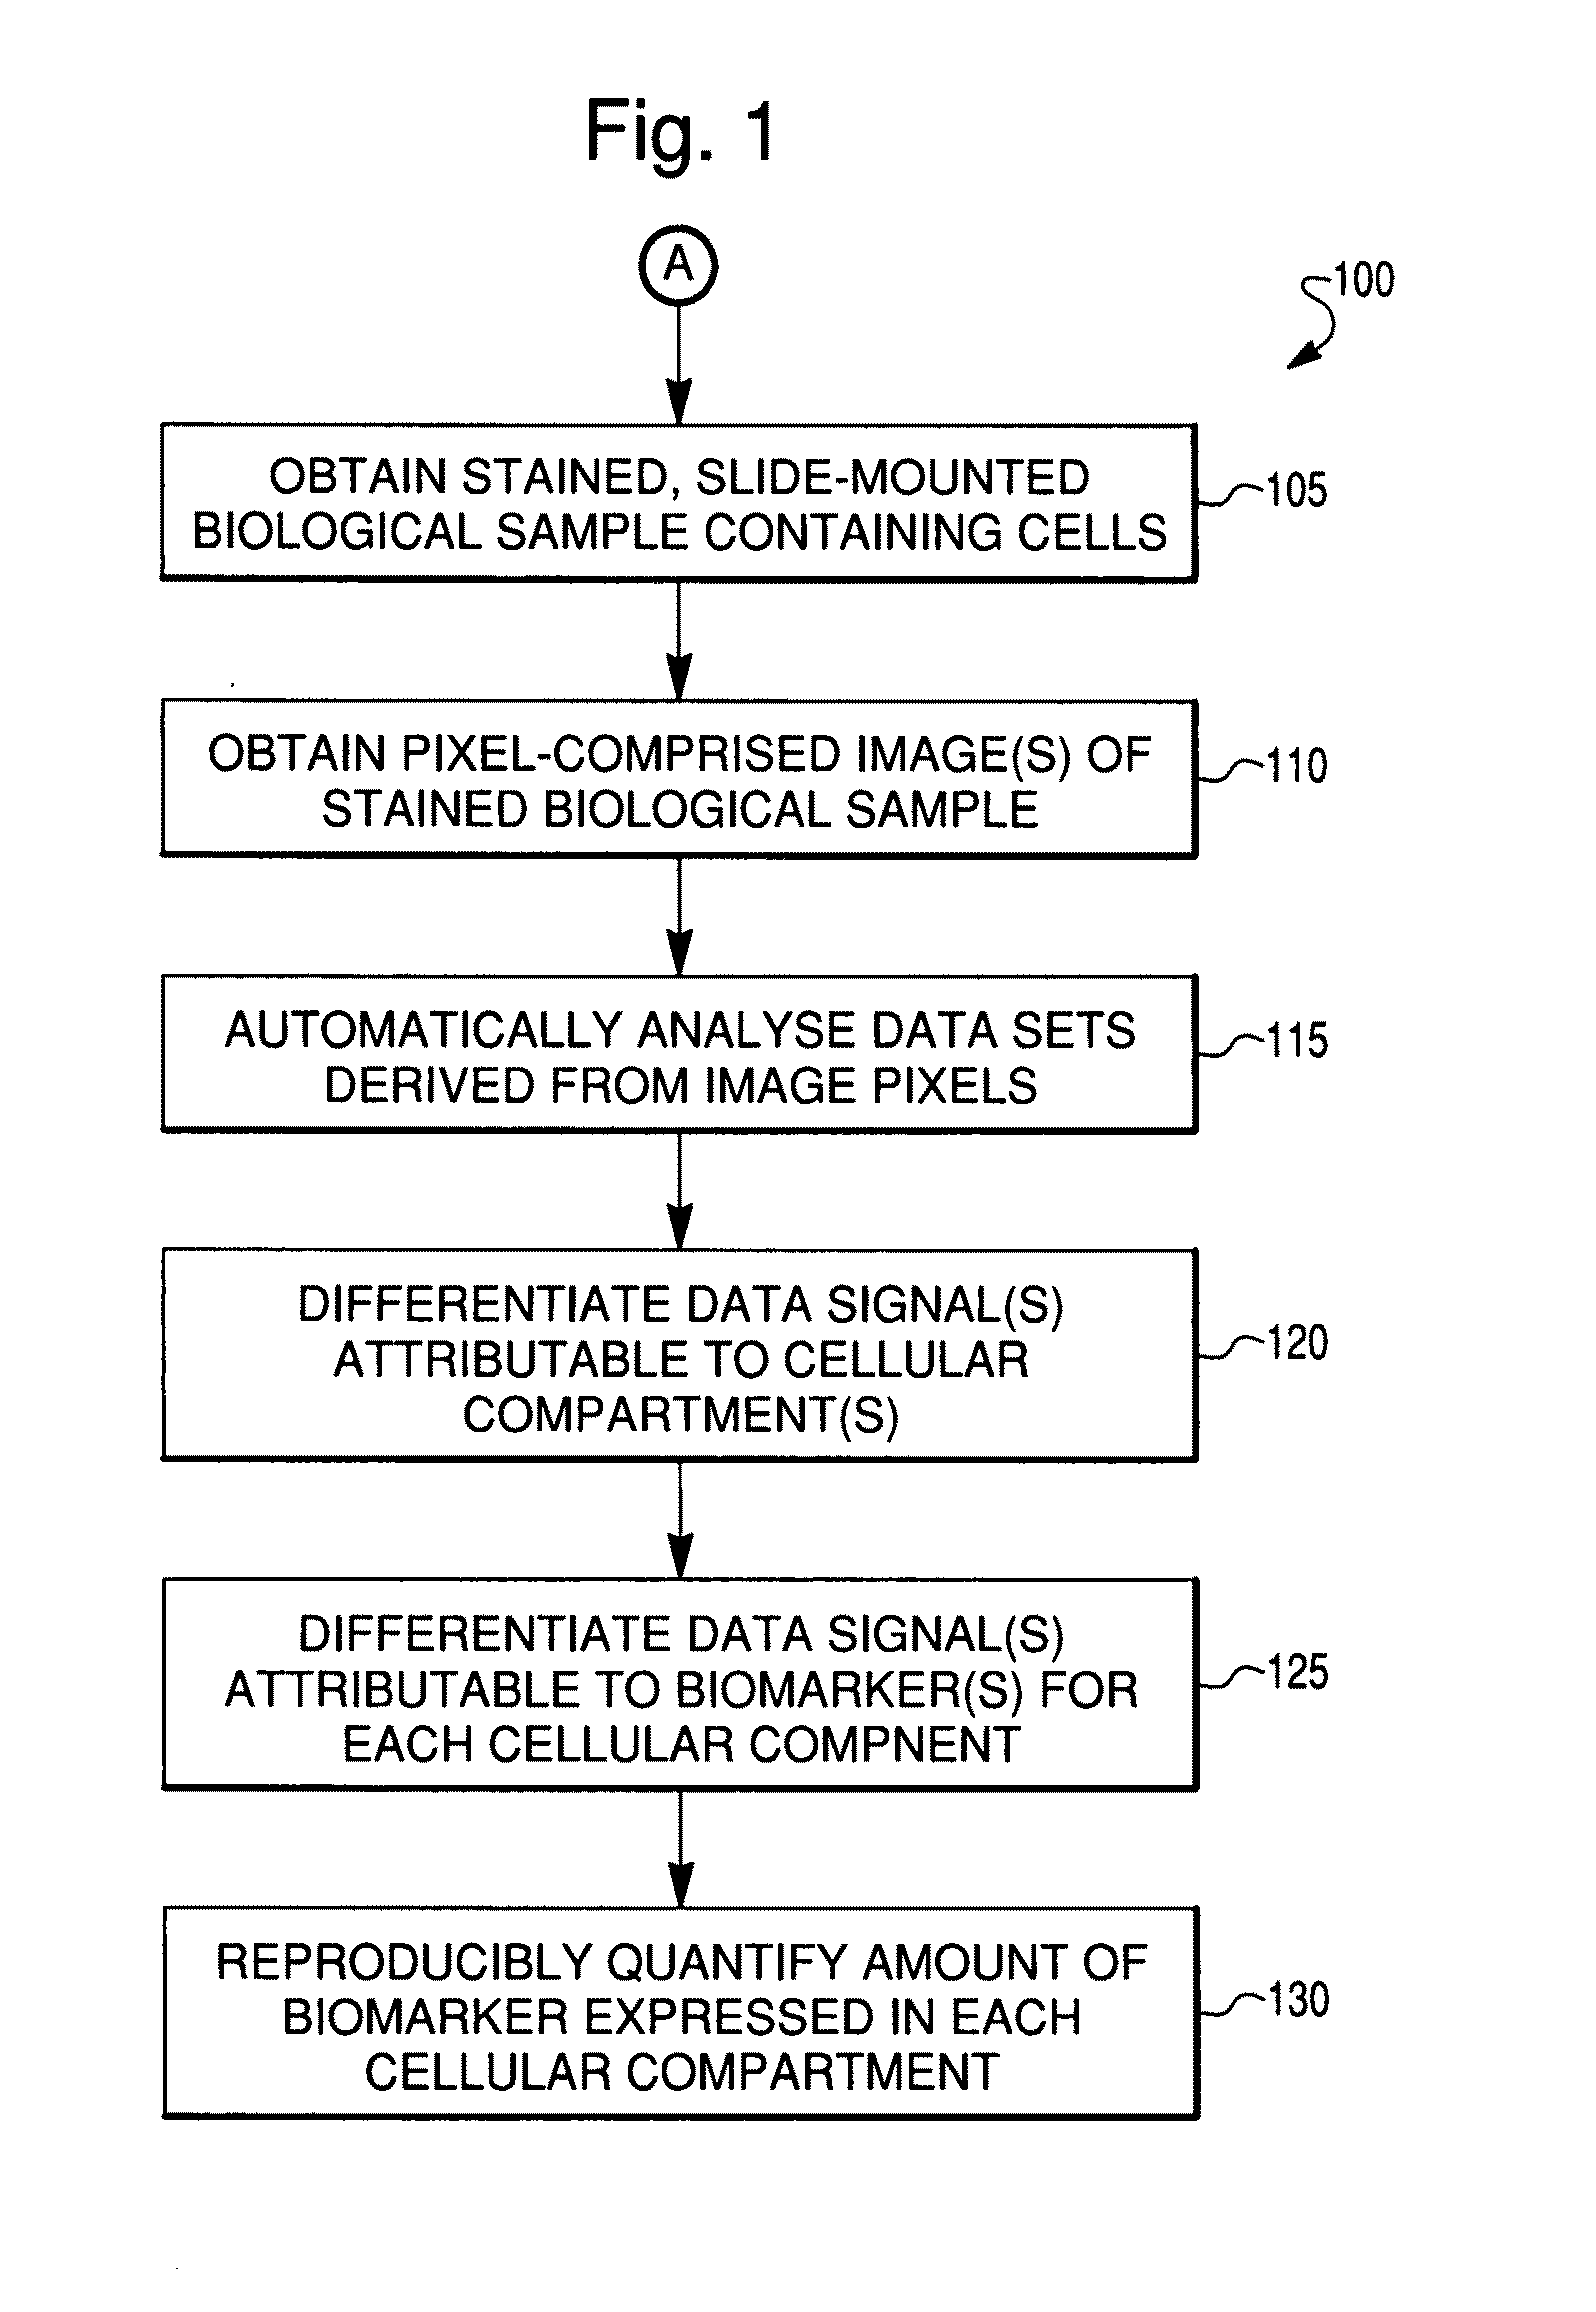
Reproducible quantification of biomarker expression
a biomarker and quantification technology, applied in the field of automatic biomarker expression analysis, can solve the problems of site affecting the value of these tests, lack of standardization, subjective nature of tests, etc., and achieve the effect of reducing variability and greater reproducibility
- Summary
- Abstract
- Description
- Claims
- Application Information
AI Technical Summary
Benefits of technology
Problems solved by technology
Method used
Image

Examples
example 1
Standardization of HER2 Analyses Using Automated Aqua® Technology
[0133]Materials and Methods
[0134]Cohort Description and TMA Construction
[0135]A large breast cancer cohort in tissue microarray (TMA) format was employed in these studies in order to test standardization techniques. This cohort from the Yale Tissue Microarray Facility (YTMA49) has been described in detail previously (Dolled-Filhart M, et al. Cancer Res. (2006) 66:5487-94). Briefly, the breast cohort (n=669) of invasive ductal carcinoma serially collected from the Yale University Department of Pathology from 1961 to 1983. Also on the array is a selection of normal tissue and cell line controls. The mean follow-up time is 12.8 years with a mean age of diagnosis of 58.1 years. This cohort contains approximately half node-positive and half node-negative specimens. Detailed treatment information was not available for this cohort.
[0136]Immunohistochemical / Immunofluoresence Tissue Staining
[0137]Chromagen-based immunohistochem...
example 2
AQUA® Analysis of EGFR
Analytical Performance Data
[0159]The methods of the present invention were applied to the evaluation of the biomarker EGFR in breast cancer tissue sections. As shown in FIG. 8A, a TMA cohort of 748 specimens was analyzed for HER2 expression by normalized AQUA® analysis across three instruments, 3 operators, and 3 separate staining runs with an average % CV of 4.3%. Preliminary analytical performance assessment was performed with EGFR PharmDx (Dako). As FIGS. 8B-D demonstrate, AQUA® analysis of EGFR expression across 3 slides and 3 staining days on a TMA composed of breast tumor and cell lines (n=152) shows a high degree of precision slide-to-slide and day-to-day with an average slope of 1.00047, an average Pearson's R of 0.95, an average % CV for tumor tissue of 3.3%, and an average % CV for cell lines of 4.7%. Taken together, these data demonstrate that AQUA® analysis allows for an EGFR assay with a high degree of precision, and combined with instrument and so...
example 3
AQUA® Analysis of ER Expression
Reproducibility
[0160]To demonstrate reproducibility of AQUAnalysis™ with another biomarker, four breast tissue blocks were obtained that represent a range of estrogen receptor (ER) expression (as judged by Allred scoring). Sections of these tissue blocks were then taken to generate H&E slides on which a board certified pathologist circled the area of tumor for all subsequent analyses. A serial set of sections was DAB stained with the monoclonal mouse anti-human estrogen receptor a, clone 1D5 antibody and evaluated for Allred scoring by the same pathologist. See, e.g., Harvey J M, et al., (1999) J. Clin. Oncol. 12:1474, which is hereby incorporated by reference in its entirety.
[0161]Serial sections were then stained using the immunofluorescence staining protocol described above. Images were collected on the HistoRx PM-2000™ microscopy platform and then passed to AQUAnalysis™ for scoring. All scores were transformed on a log 2 scale.
[0162]Image files for...
PUM
| Property | Measurement | Unit |
|---|---|---|
| optical path variability | aaaaa | aaaaa |
| % CV | aaaaa | aaaaa |
| CV | aaaaa | aaaaa |
Abstract
Description
Claims
Application Information