Method, apparatus and computer program for analysing medical image data

a technology of image data and computer program, applied in the field of image analysis, can solve the problems of less well developed, more complex and difficult to distinguish diagnostic patient groups from visually normal areas of the liver, and the use of computer analysis to characterise rather than detect mammographic abnormalities, etc., and achieves the effect of easy tuning and easy implementation

Inactive Publication Date: 2010-06-10
TEXRAD
View PDF19 Cites 38 Cited by
  • Summary
  • Abstract
  • Description
  • Claims
  • Application Information

AI Technical Summary

Benefits of technology

[0020]The biomarker can be obtained by analysing conventional images, and therefore the invention can be easily implemented as an addition to existing image systems. Optionally, the image data may represent one of an X-ray image, in particular a tomography image (e.g. a hepatic, lung oesophagus or dental tomography image) or a mammography image, a magnetic resonance image (e.g. a brain image) and an ultrasound image. A tomography image may be, for example, a computed tomography (CT) image, which is also known as a computed axial tomography (CAT) image, or a positron emission tomography (PET) image or a single photon emission computed tomography (SPECT) image. The image is usually two-dimensional (e.g. an image slice), but may alternatively be threedimensional (e.g. an image volume).
[0021]The band-pass filters may differ in only bandwidth and be otherwise identical. In other words, the data may be filtered more than once with the same filter tuned to different bandwidths. The filtering is described as being performed with a plurality of filters having different bandwidths for clarity and conciseness. Optionally, the band-pass filters may be Laplacian of Gaussian (LoG) band-pass filters. Such a filter is advantageous in that it can be tuned easily to provide different bandwidths.

Problems solved by technology

For example, colorectal cancer patients entering surveillance programs do not represent a uniform population of equal risk of recurrence.
However it is more complex and challenging to distinguish diagnostic patient groups from visually normal areas of the liver of patients following resection of colorectal cancer.
The use of computer analysis to characterise rather than detect mammographic abnormalities is more challenging and less well developed.

Method used


Image

  • Method, apparatus and computer program for analysing medical image data
  • Method, apparatus and computer program for analysing medical image data
  • Method, apparatus and computer program for analysing medical image data

Examples


Embodiment Construction

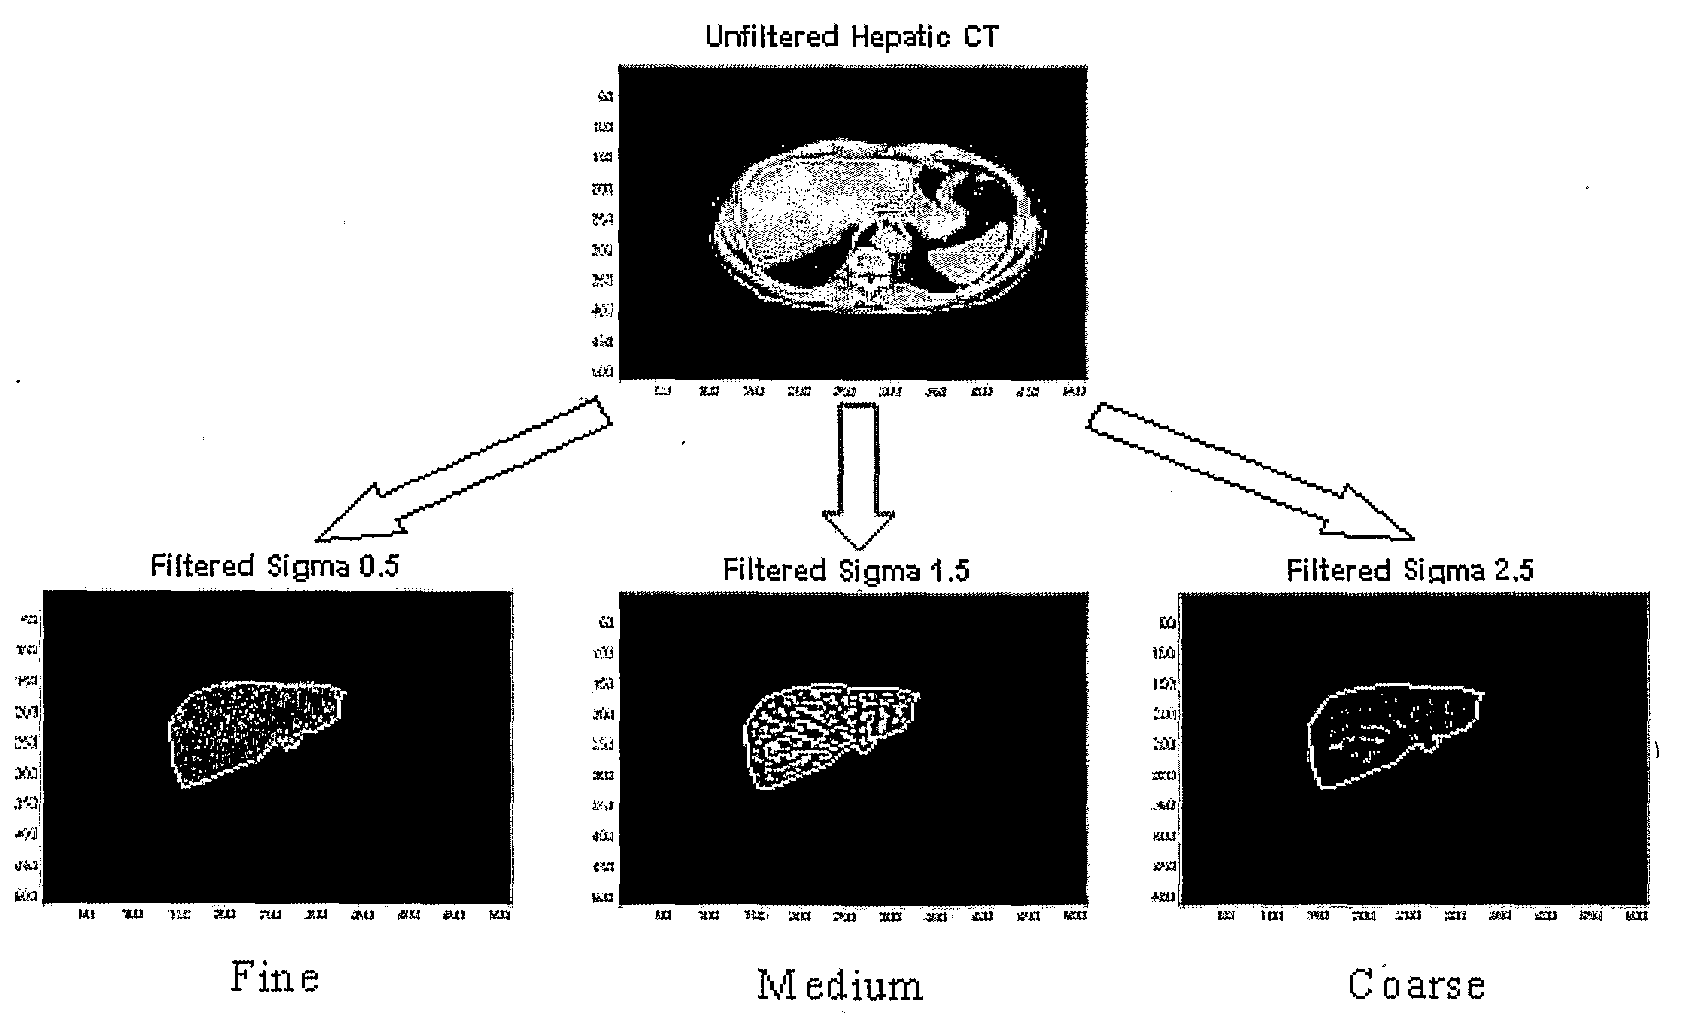
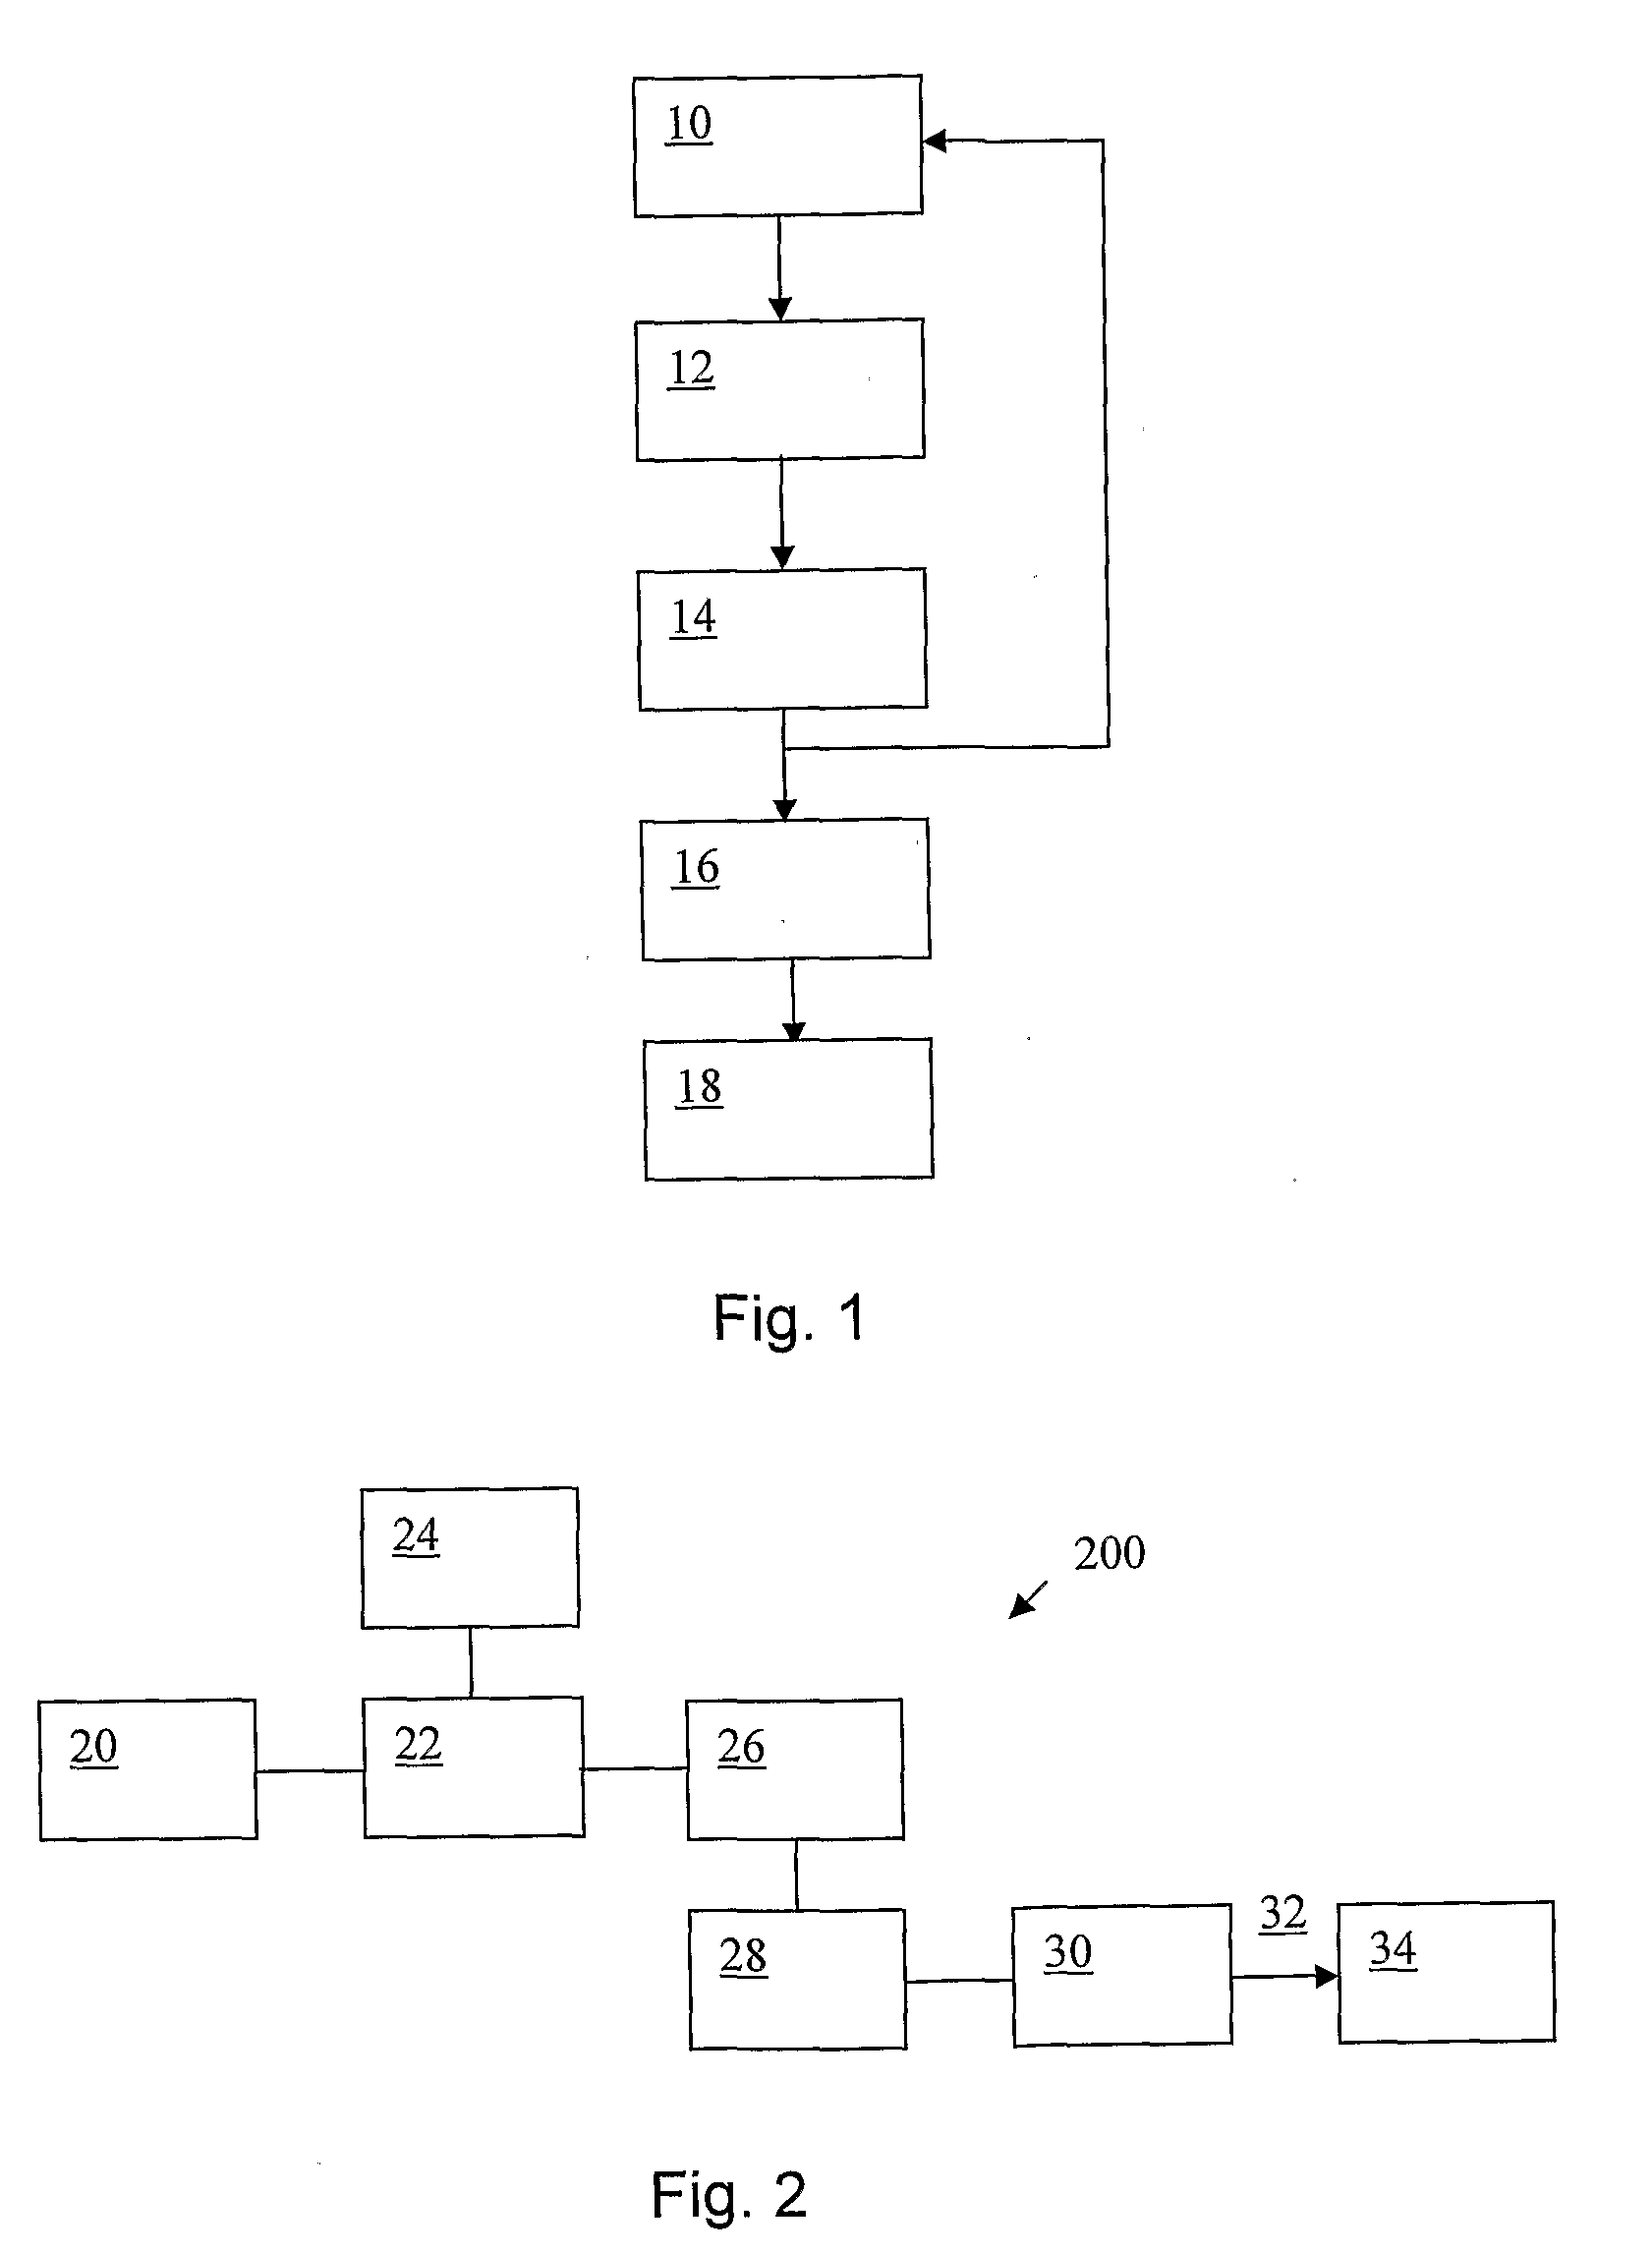
[0043]Referring to FIG. 1, the method of analysing medical image data commences at step 10 by selecting the bandwidth of a filter. At step 12 the image data is filtered by the filter employing the selected bandwidth. At step 14 a texture parameter is determined from the filtered data. Flow then returns to step 10 where a different bandwidth is selected and then at step 12 the image data is filtered by the filter employing the different bandwidth, and then at step 14 a texture parameter is determined from the data filtered using different bandwidth. Steps 10, 12 and 14 may be repeated any desired number of times. For example, three different bandwidths may be used to provide fine, medium and coarse filtering and corresponding fine, medium and coarse texture parameters. At step 16 a ratio is calculated of two of the texture parameters corresponding to different filter bandwidths, and optionally additional ratios may be calculated using different pairs of the texture parameters. The ra...


PUM


Abstract

Medical image data is analysed to produce a biomarker. The data is filtered with a plurality of band-pass filters each having a different bandwidth. A texture parameter is then determined from the filtered data from each filter and the biomarker is determined as at a ratio of the texture parameters. When the biomarker is obtained from a CT image of a liver, it can be predictive of poor survival, disease extent and liver physiology of a patient following resection of colorectal cancer. When obtained from a mammographic image, the biomarker can be indicative of cancer invasion and receptor status within mammographic abnormalities. When obtained from a CT image of a lung nodule, the biomarker can be predictive of tumour stage (or grading) and tumour metabolism of a patient with non-small cell lung carcinoma (lung cancer). When obtained from an MRI image of the brain, the biomarker can be indicative of schizophrenia and / or other brain disorders.

Description

FIELD OF THE INVENTION[0001]The invention relates to image analysis for assisting medical diagnosis or prognosis, and in particular to the analysis of textural data.BACKGROUND TO THE INVENTION[0002]Images of parts of the body are commonly used to assisting with medical diagnosis and prognosis. Images include X-ray images, in particular computed tomography (CT) and mammographic images, and magnetic resonance imaging (MRI) images. Visual inspection of such images can be very effective. However, increasingly, image processing techniques are being employed to enhance the usefulness of these images and the accuracy of diagnosis and prognosis.[0003]For example, colorectal cancer patients entering surveillance programs do not represent a uniform population of equal risk of recurrence. It is desirable to identify predictive factors that are linked to outcomes in order to allow modification of surveillance strategies for sub-groups of patients. Of particular interest is the use of imaging te...

Claims


Application Information

Patent Timeline
Patent Type & Authority Applications(United States)
IPC IPC(8): G06K9/00
CPCG06K9/4609G06K2209/05G06T7/0012G06T7/401G06T2207/30056G06T2207/10088G06T2207/30028G06T2207/30092G06T2207/10081G06T7/44G06V10/443G06V2201/03G16H30/40G16H50/20
Inventor GANESHAN, BALAJIMILES, KENNETH ALANYOUNG, RUPERT CHARLES DAVIDCHATWIN, CHRISTOPHER REGINALD
Owner TEXRAD
Why Eureka
Try Eureka