Methods for measuring adp
a technology of adp and methods, applied in the field of assays for detecting and measuring adp, can solve the problems of limiting throughput, requiring filtration separation, and low throughput, and achieve the effects of improving detection accuracy and reproducibility
- Summary
- Abstract
- Description
- Claims
- Application Information
AI Technical Summary
Problems solved by technology
Method used
Image
Examples
example 1
Reagents
[0037]All of the substrates, buffers, enzymes and cofactors for steps 1 and 2 of an enzyme-coupling scheme, described above, can be supplied in a single mixture, Reagent A. All of the substrates, buffers, enzymes and cofactors for step 3 and 4 can be supplied in Reagent B. Reagents A and B having the following compositions were used in the assays described here in below.
CompositionsReagent AReagent BHepesHepesDTTDTTMgCl2beta-glycerol phosphateNaFphosphoenolpyruvateGlycerolcoenzyme ANon-ionic detergentthiamine pyrophosphateriboflavin momophosphateNicotinomide adenine dinucleotidedecyl aldehyde or other long chainaldehydePyruvate KinaseEDTAPyruvate dehydrogenaseluciferase (containing NADH: FMNoxidoreductase)
Assay Procedures
[0038]1. Add 10 μl reagent A to 30 μl kinase reaction mixtures and incubate at RT.
[0039]2. Add 10 μl reagent B and read luminescence immediately.
example 2
Luminescence Correlates with Amount of ADP
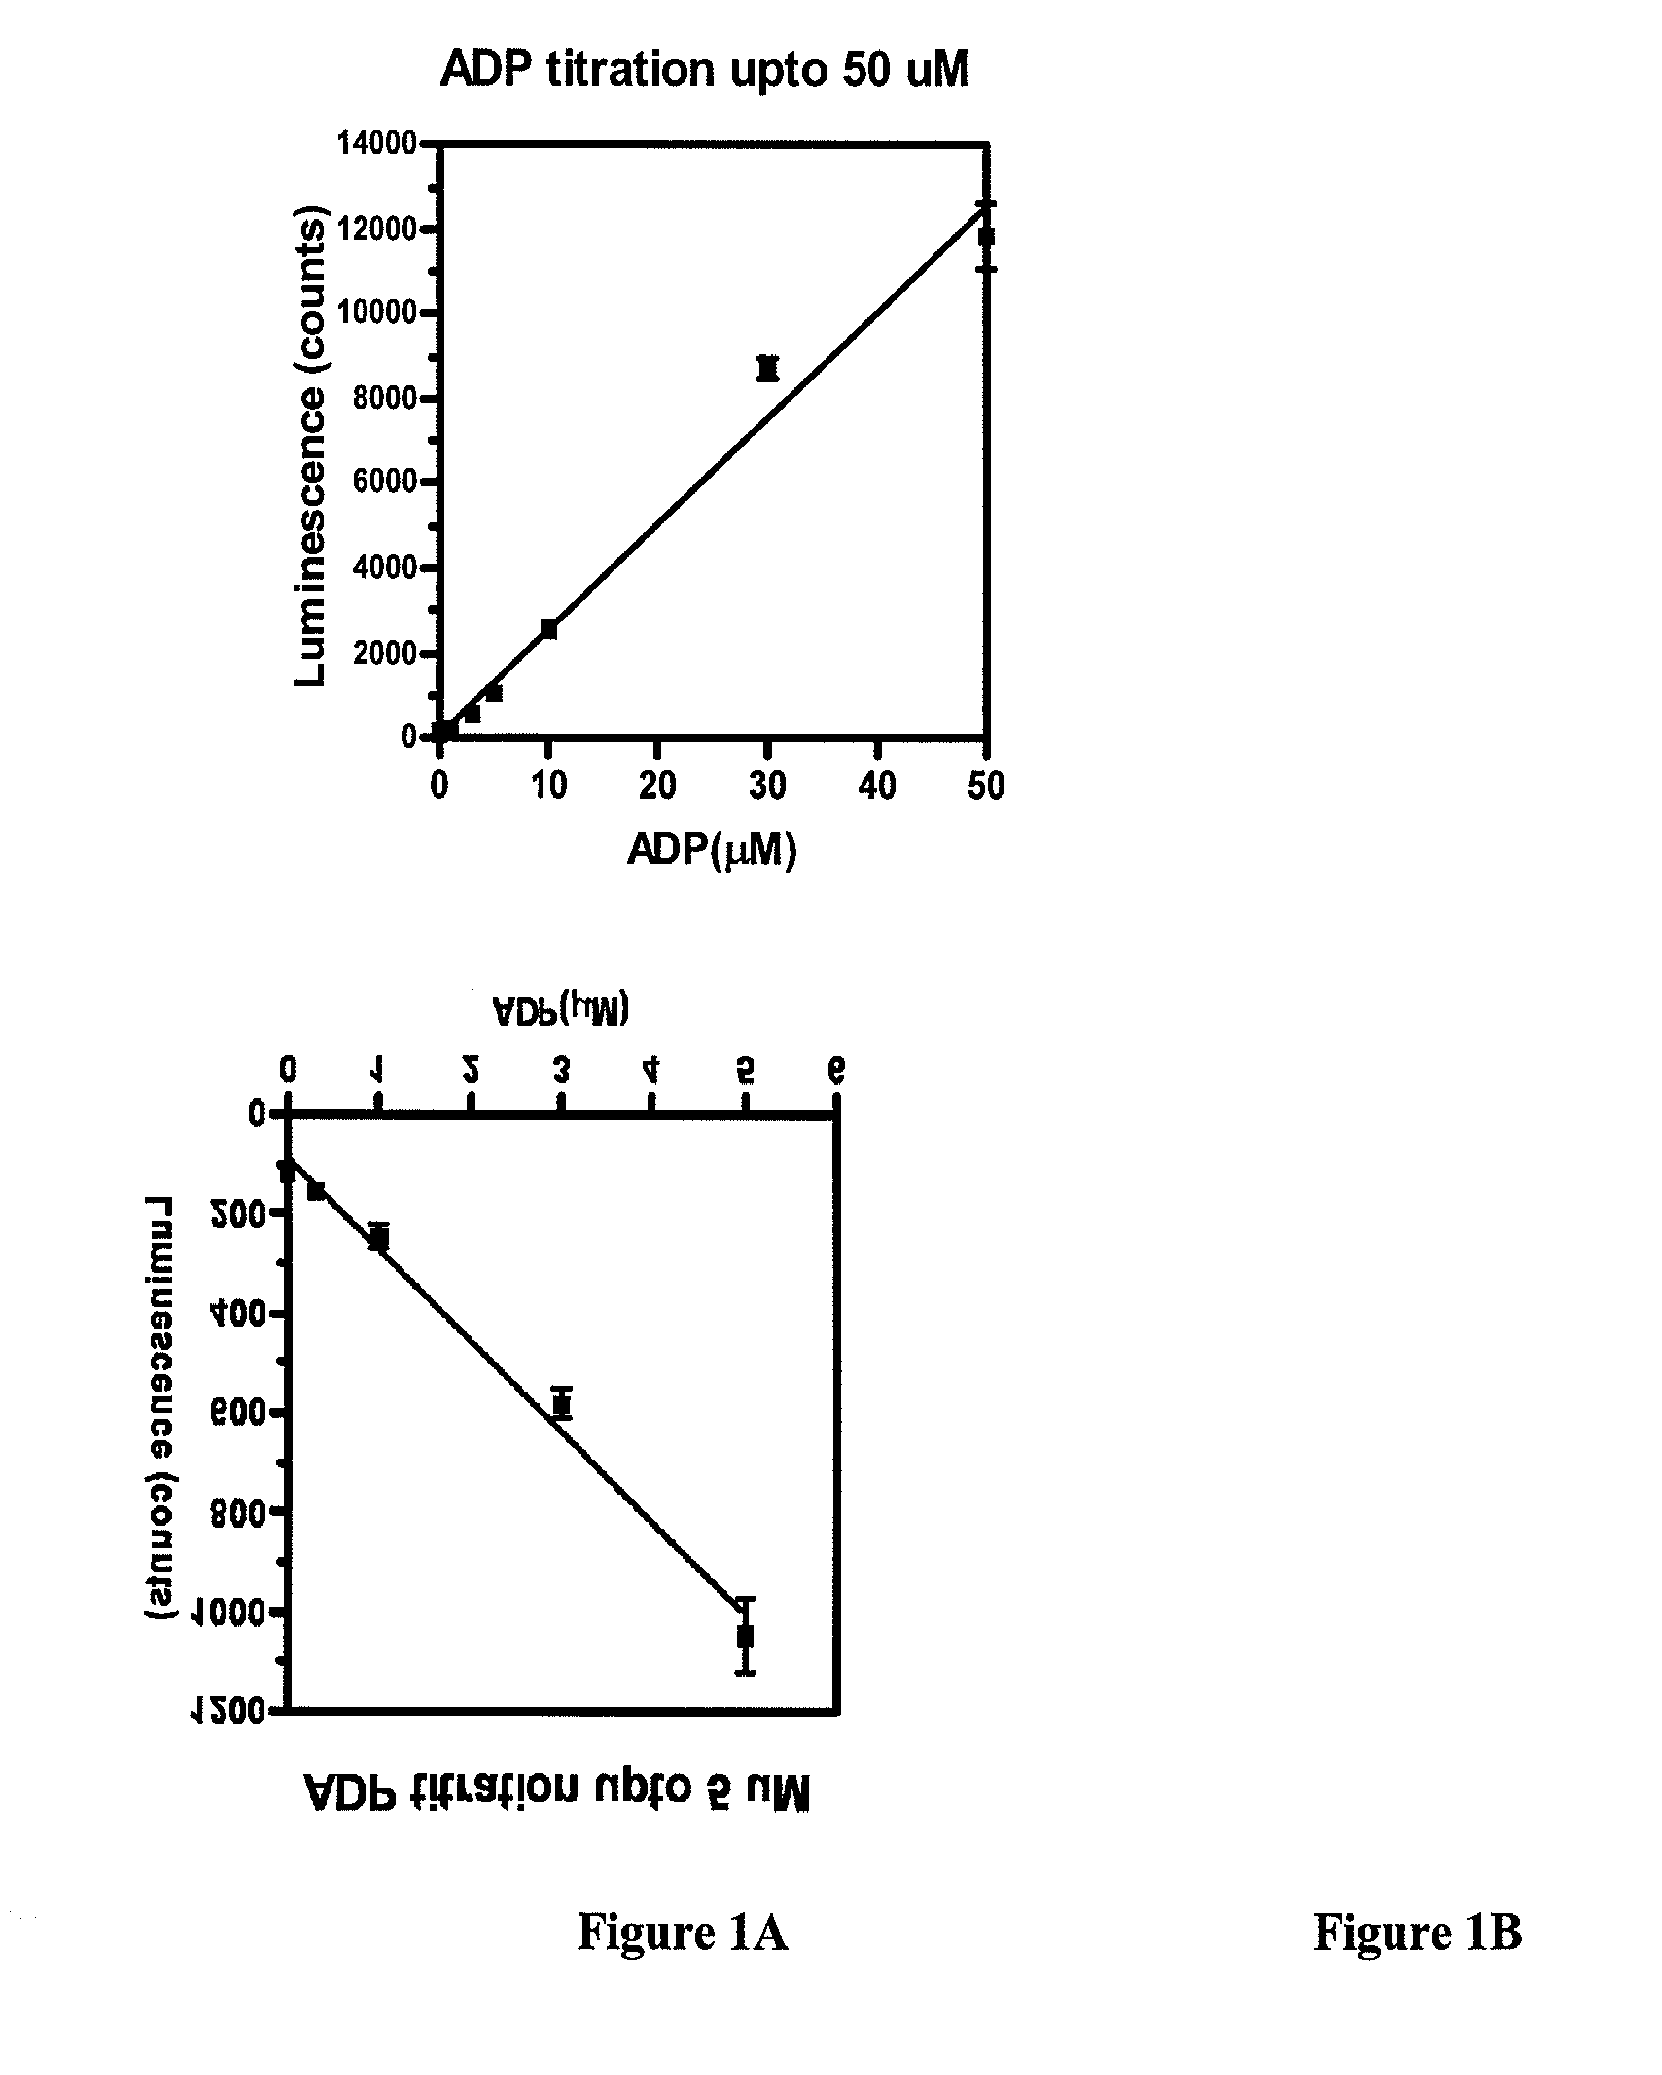
[0040]30 μl of 0, 0.3, 1, 3, 5, 10, 30 and 50 μM of ADP in kinase buffer (20 mM Hepes, pH7.5, 10 mM MgCl2 and 1 mM DTT) were aliquoted in a solid white 96 well plate, and 10 μl of reagent A were added to each well. The plate was incubated at room temperature for 15 minutes. At the end of incubation, 10 μl of Reagent B were added to each well and luminescence was measured immediately using a DTX880 multimode detector. The results, summarized in Table 2, were plotted as shown in FIGS. 1A-1B. Each data point is the average of 12 repeats.
TABLE 2ADP(μM)z′s / n10.802.130.765.050.778.9100.7921.9300.9274.0500.80100.5“z′” measures the reproducibility of the assay. Z′ = 1 − 3 * (stdev of signal + stdev of background) / (signal-background). For a good assay, z′ has to be bigger than 0.5. The bigger the Z′, the better the assay.“s / n” represents signal to noise ratio.
[0041]As the plots show, a direct relationship exists between luminescence measured with ADP...
example 3
Luminesence Correlates with Kinase Activity and Reaction Time
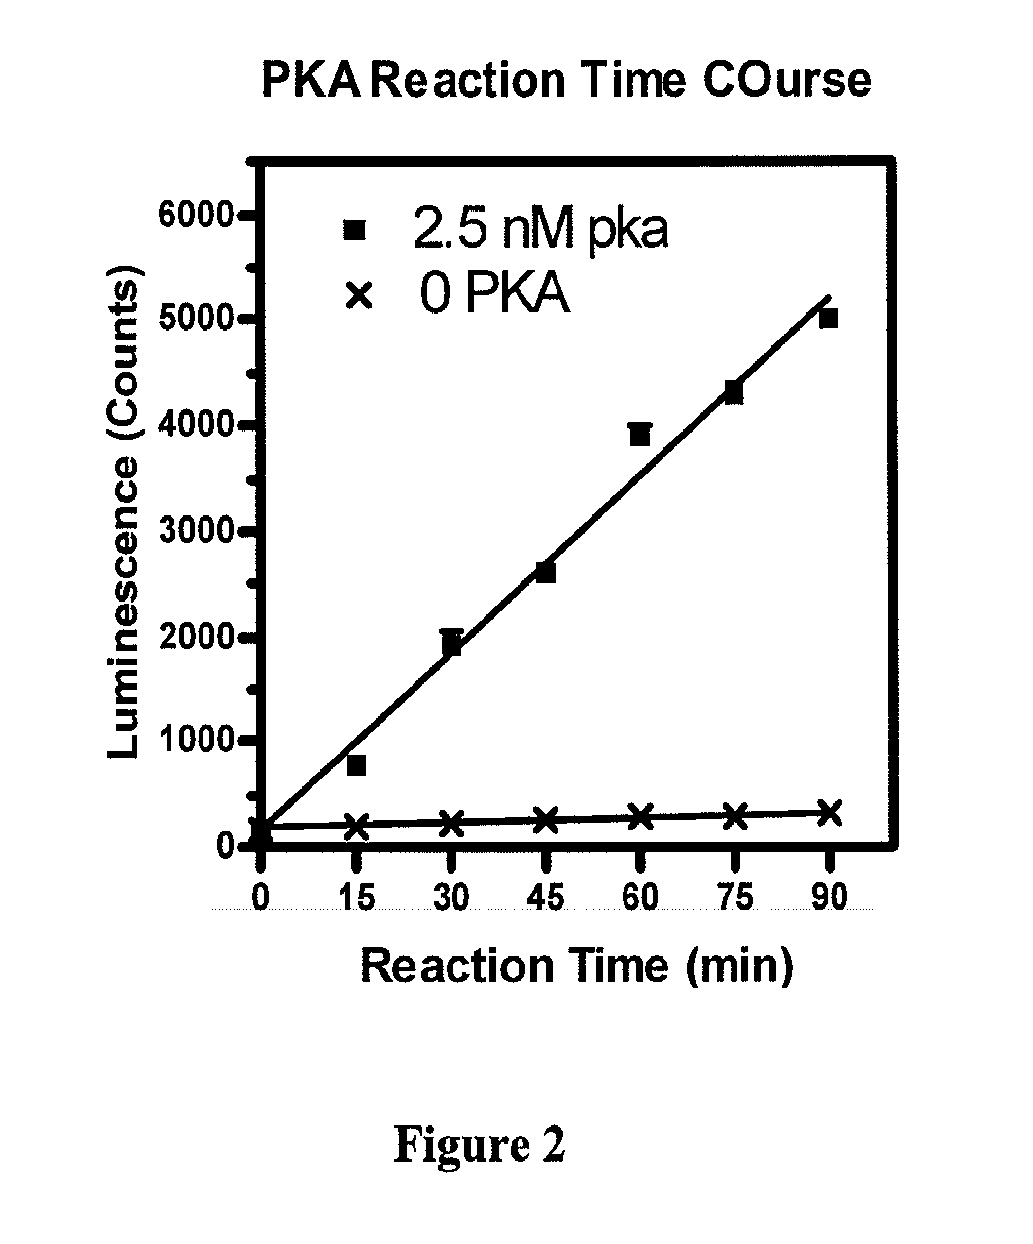
[0042]30 μl PKA reactions in 20 mM Hepes, pH7.5, 10 mM MgCl2 and 1 mM DTT, with 5 μM ATP, 30 μM Kemptide, 0 or 2.5 nM PKA were incubated with 10 μl Reagent A at room temperature for 0, 15, 30, 45, 60, 75 and 90 minutes. At the end of incubation, 10 μl Reagent B were added and luminescence measured. The results are shown in FIG. 2. Each data point represents the average of 3 repeats. As shown in FIG. 2, a direct linear correlation exists between luminescence and PKA reaction time. When no PKA is added, no ADP is generated and hence, no luminescence increases.
PUM
| Property | Measurement | Unit |
|---|---|---|
| volumes | aaaaa | aaaaa |
| volumes | aaaaa | aaaaa |
| temperature | aaaaa | aaaaa |
Abstract
Description
Claims
Application Information
 - R&D
- Intellectual Property
- Life Sciences
- Materials
- Tech Scout
- Unparalleled Data Quality
- Higher Quality Content
- 60% Fewer Hallucinations
Browse by: Latest US Patents, China's latest patents, Technical Efficacy Thesaurus, Application Domain, Technology Topic, Popular Technical Reports.
© 2025 PatSnap. All rights reserved.Legal|Privacy policy|Modern Slavery Act Transparency Statement|Sitemap|About US| Contact US: help@patsnap.com


