Eureka AIR delivers breakthrough ideas for toughest innovation challenges, trusted by R&D personnel around the world.

System and method for texture visualization and image analysis to differentiate between malignant and benign lesions

a texture visualization and image analysis technology, applied in image analysis, image enhancement, instruments, etc., can solve the problems of large increase in the number of asymptomatic mammograms presented, unnecessary biopsies, and insufficient results

Inactive Publication Date: 2010-10-21
RAMSAY THOMAS E +4
View PDF3 Cites 57 Cited by
  • Summary
  • Abstract
  • Description
  • Claims
  • Application Information

AI Technical Summary

Benefits of technology

[0021]Therefore, an object of the present invention is to provide a system capable of detecting medical objects of interest in image data with a high degree of confidence and accuracy.
[0023]Another object of the present invention is to provide a system and method of identifying objects of interest in medical image data that is effective at analyzing images in both two- and three-dimensional representational space using either pixels or voxels.
[0026]Another object of the present invention is to provide a system and method of identifying objects of interest in medical image data that can cause either convergence or divergence (clusterization) of explicit or implicit image object characteristics that can be useful in creating discriminating features / characteristics.
[0028]Another object of the present invention is to provide a system and method of identifying objects of interest in medical image data that is stable and repeatable in its behavior.

Problems solved by technology

This, in turn, has lead to a large increase in the number of asymptomatic mammograms being presented, the majority of which are normal and resulted in unnecessary biopsies.
Similar issues confront accurate diagnosis of a sub-dermal hematoma in computer tomography (CT) scans and distinguishing tuberculosis bacilli from debris in digital images taken of stained sputum slides through a microscope.
Advances have been made to locate suspicious areas (ROI—Region of interest) but the outcome has been inadequate, specifically in small, subtle, dense lesions and infrequent abnormalities.
Unfortunately, this is not the case.
Dense breast tissue provides an even greater challenge to the image analysis task.
Comparing results from multiple modalities adds further complexity to the image analysis process, since it may be difficult to compare the exact location of a mass using ultrasound with its position in two different views in a mammogram or with a sequence of images created by an MRI device.
These processes using intensity thresholding are unreliable due to between-image and within-image intensity variations.

Method used


Image

  • System and method for texture visualization and image analysis to differentiate between malignant and benign lesions
  • System and method for texture visualization and image analysis to differentiate between malignant and benign lesions
  • System and method for texture visualization and image analysis to differentiate between malignant and benign lesions

Examples


Embodiment Construction

Definition of Terms

[0070]The following definitions hold throughout the contents of this application. If additional or alternative definitions of the same or similar words are provided herein, those definitions should be included herein as well.

[0071]“Statistically identical” or “statistically indistinguishable”: Two sets of data are referred to as “statistically identical” or “statistically indistinguishable” if under one or more types of statistics or observation there is almost no discernible difference between them.

[0072]Point operation: Point operation is a mapping of a plurality of data from one space to another space which, for example, can be a point-to-point mapping from one coordinate system to a different coordinate system. Such data can be represented, for example, by coordinates such as (x, y) and mapped to different coordinates (α, β) values of pixels in an image.

[0073]Z effective (Zeff): Is the effective atomic number for a mixture / compound of elements. It is an atomic...


PUM


Abstract

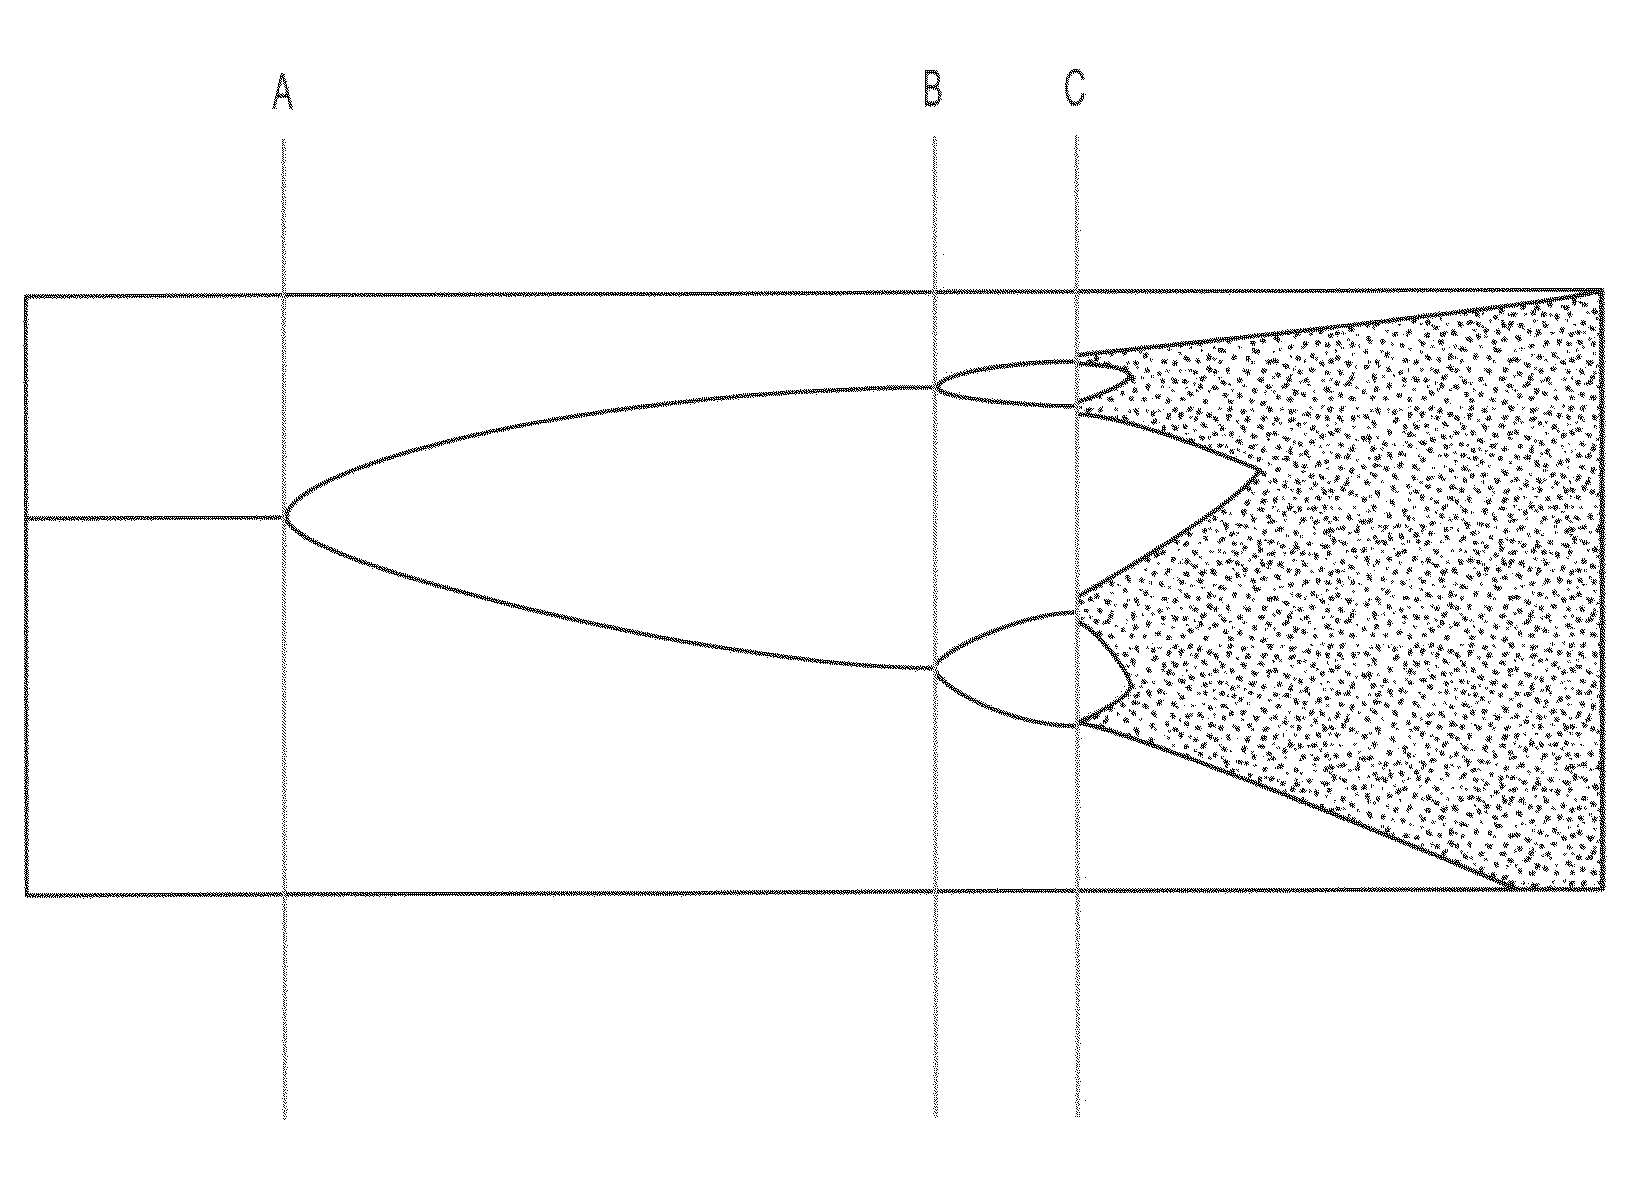
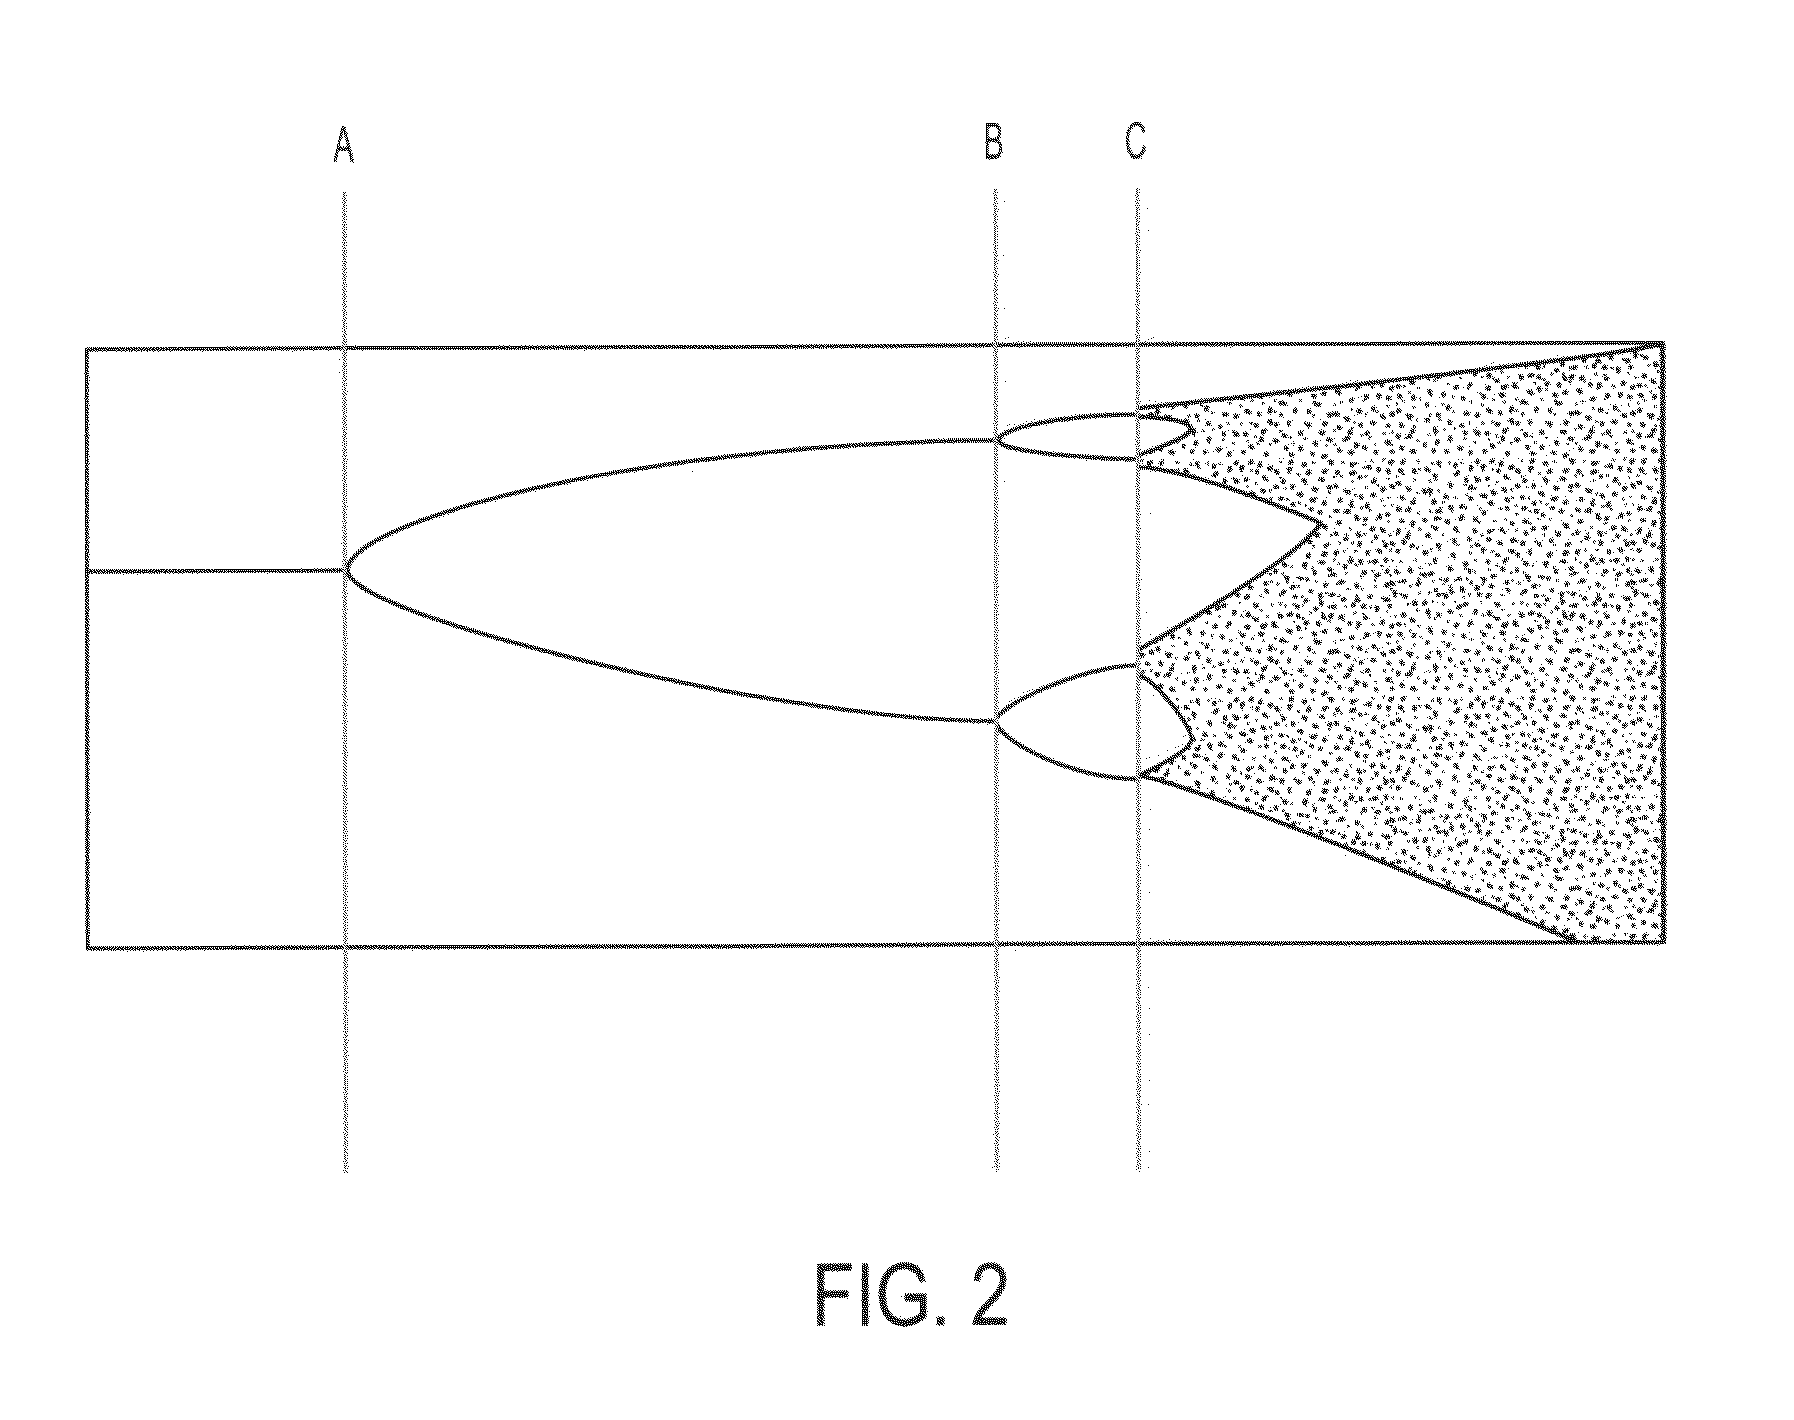
A system and method for the analysis and visualization of normal and abnormal tissues, objects and structures in digital images generated by medical image sources is provided. The present invention utilizes principles of Iterative Transformational Divergence in which objects in images, when subjected to special transformations, will exhibit radically different responses based on the physical, chemical, or numerical properties of the object or its representation (such as images), combined with machine learning capabilities. Using the system and methods of the present invention, certain objects, such as cancerous growths, that appear indistinguishable from other objects to the eye or computer recognition systems, or are otherwise almost identical, generate radically different and statistically significant differences in the image describers (metrics) that can be easily measured.

Description

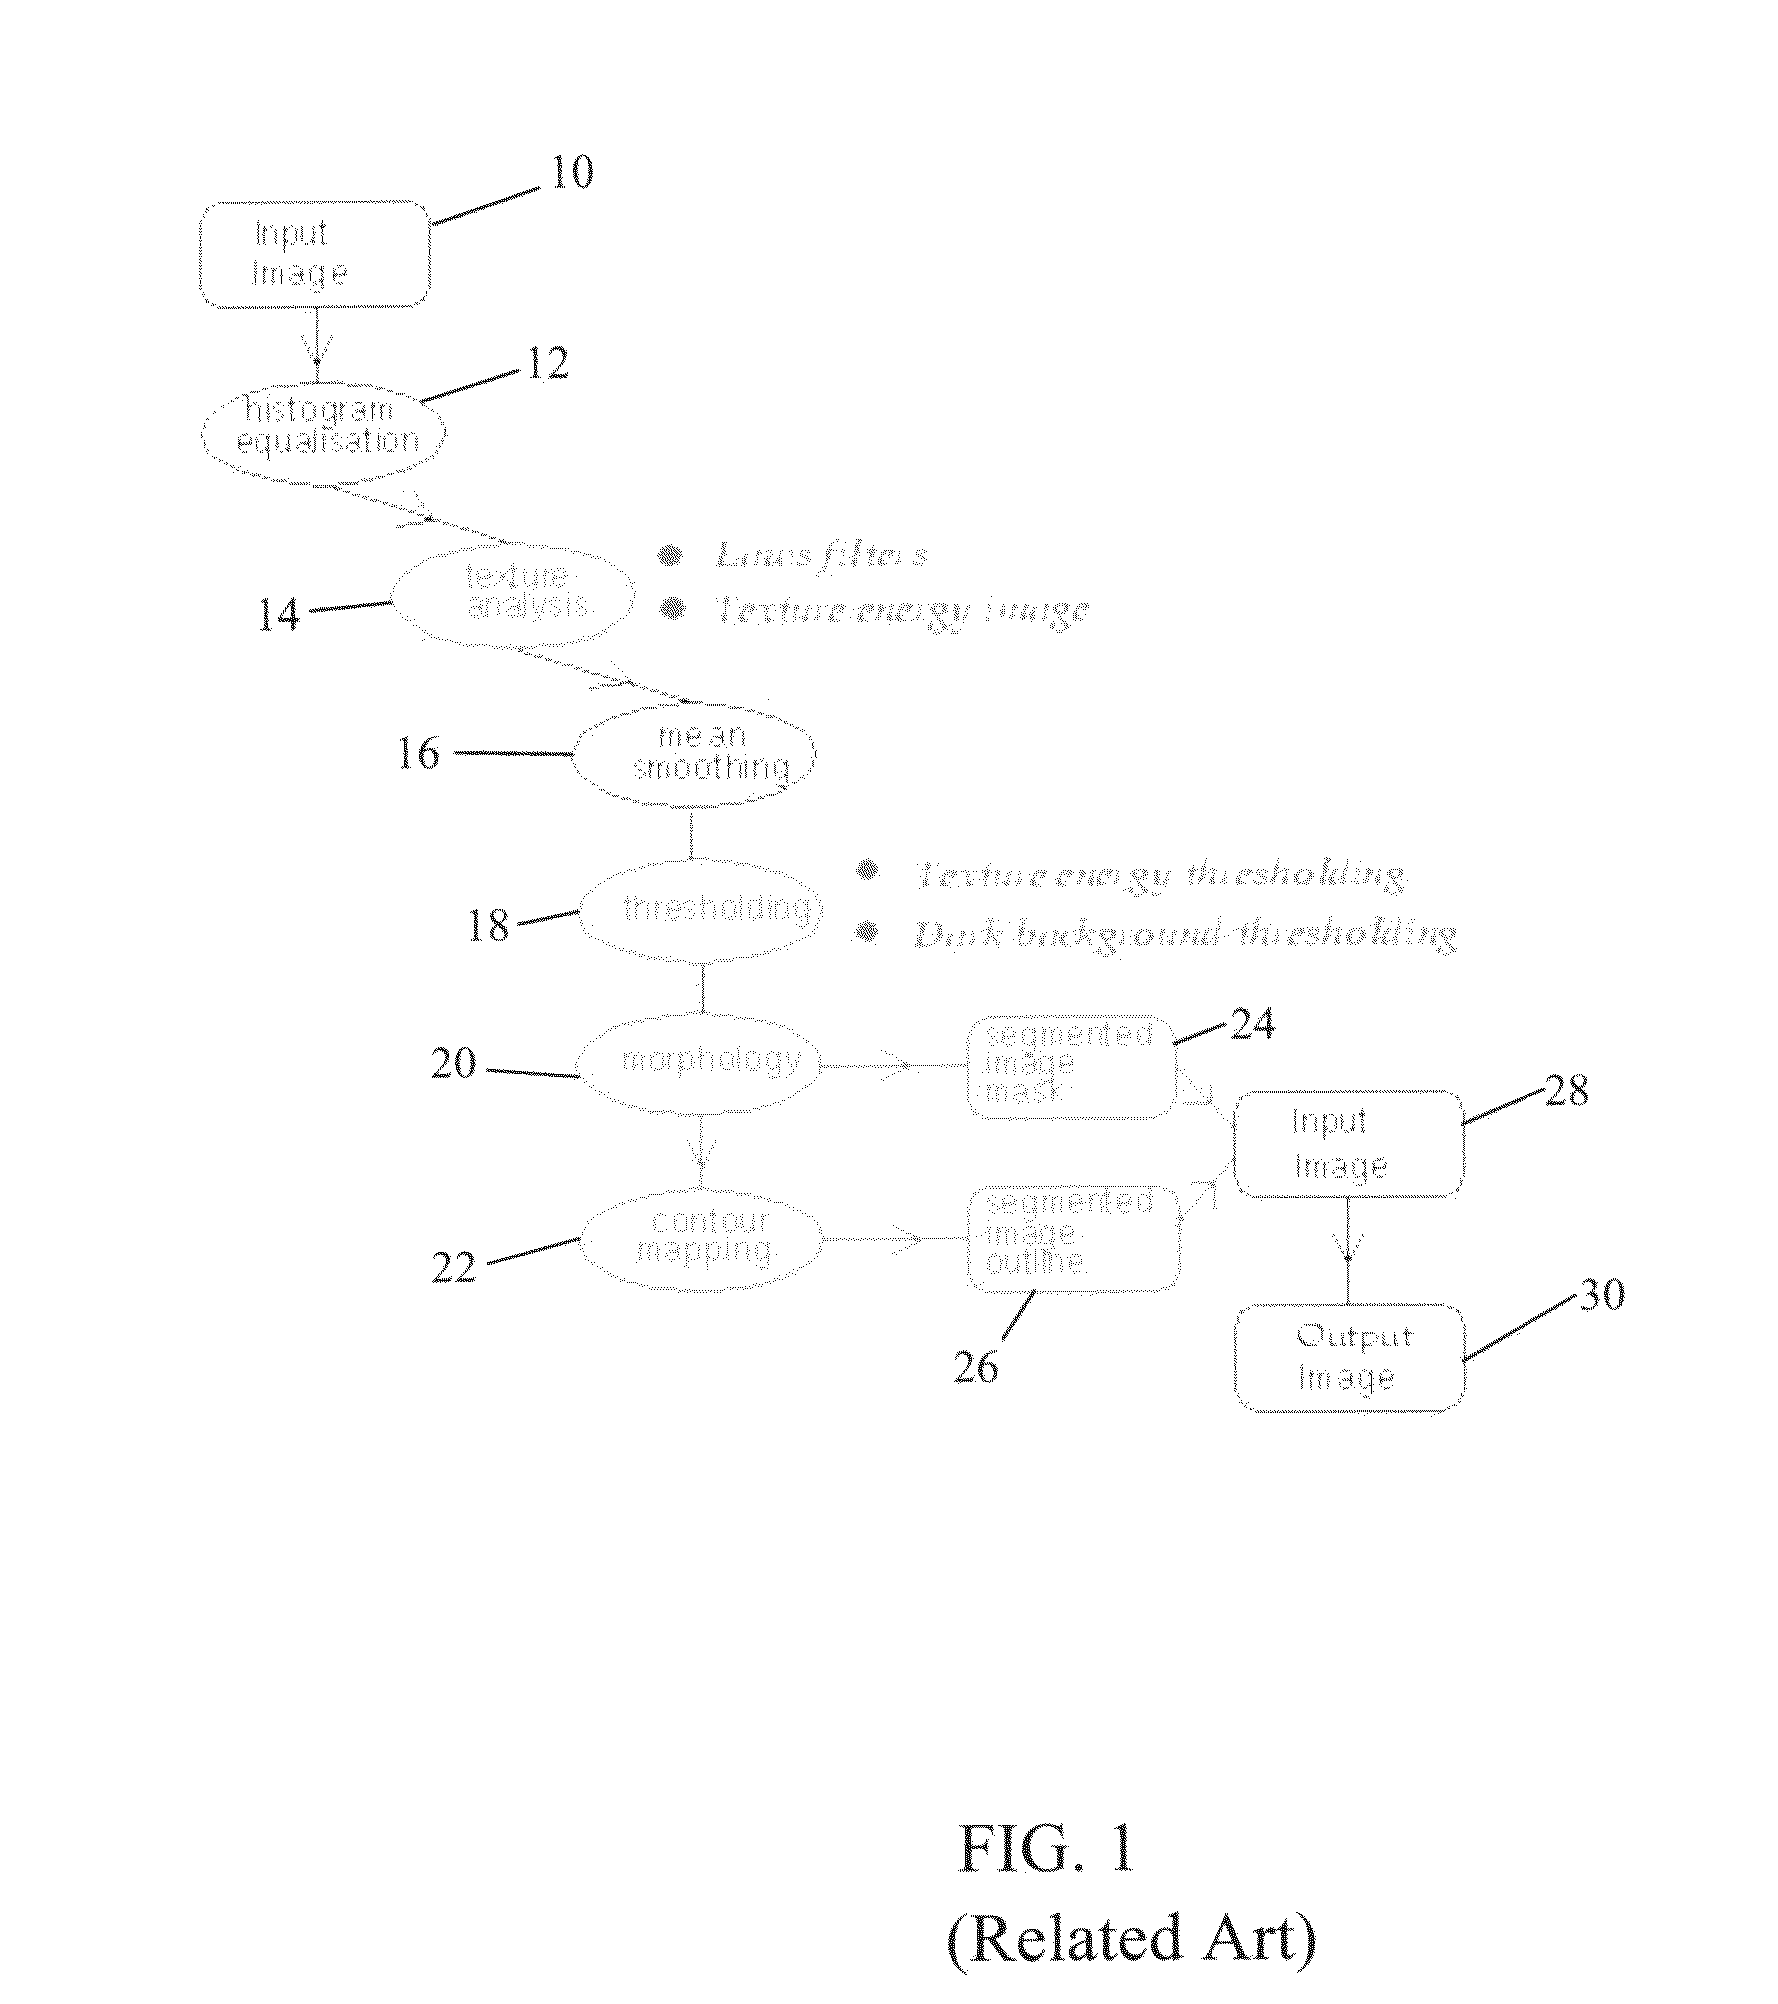
REFERENCE TO RELATED APPLICATIONS[0001]This application is a continuation-in-part of U.S. patent application Ser. No. 11 / 374,612, filed on Mar. 14, 2006, which is a continuation-in-part of U.S. patent application Ser. No. 11 / 136,406, filed May 25, 2005 (now U.S. Pat. No. 7,496,218) and U.S. patent application Ser. No. 11 / 136,526, filed May 25, 2005 (now U.S. Pat. No. 7,492,937). This application also claims priority to U.S. Provisional Patent Application No. 61 / 118,027, filed Nov. 26, 2008. All of the above-identified applications are incorporated herein by reference in their entirety.BACKGROUND OF THE INVENTION[0002]1. Field of the Invention[0003]This invention relates to image analysis and, more specifically, to a system and method for the analysis and visualization of normal and abnormal tissues, objects and structures in digital images generated by medical image sources.[0004]2. Background of the Related Art[0005]Breast cancer is the most common cancer in women. Early detection ...

Claims


Application Information

Patent Timeline
IPC IPC(8): G06K9/00
CPCG06T7/0012G06T7/403G06T2207/10072G06T2207/10116G06T2207/30096G06T2207/20081G06T2207/20221G06T2207/30068G06T2207/10132G06T7/44
Inventor RAMSAY, THOMAS E.RAMSAY, EUGENE B.KRIVOROTOV, VICTORFELTEAU, GERARDANDRUSHCHENKO, OLEKSANDR
Owner RAMSAY THOMAS E
Why Eureka
Eureka Blog
Learn More