
In-band optical noise measurement using differential polarization response

a technology of differential polarization response and in-band optical noise, which is applied in the direction of electrical equipment, electrical transmission, transmission monitoring, etc., can solve the problems of increasing the difficulty of achieving a reliable measurement of the noise level within the channel bandwidth, severe spectral characteristics requirements, and increasing difficulty in achieving reliable measurement of the noise level in the channel bandwidth. , to achieve the effect of less stringent requirements and significant reduction of measurement tim

Active Publication Date: 2011-04-21
EXFO
View PDF31 Cites 12 Cited by
  • Summary
  • Abstract
  • Description
  • Claims
  • Application Information

AI Technical Summary

Benefits of technology

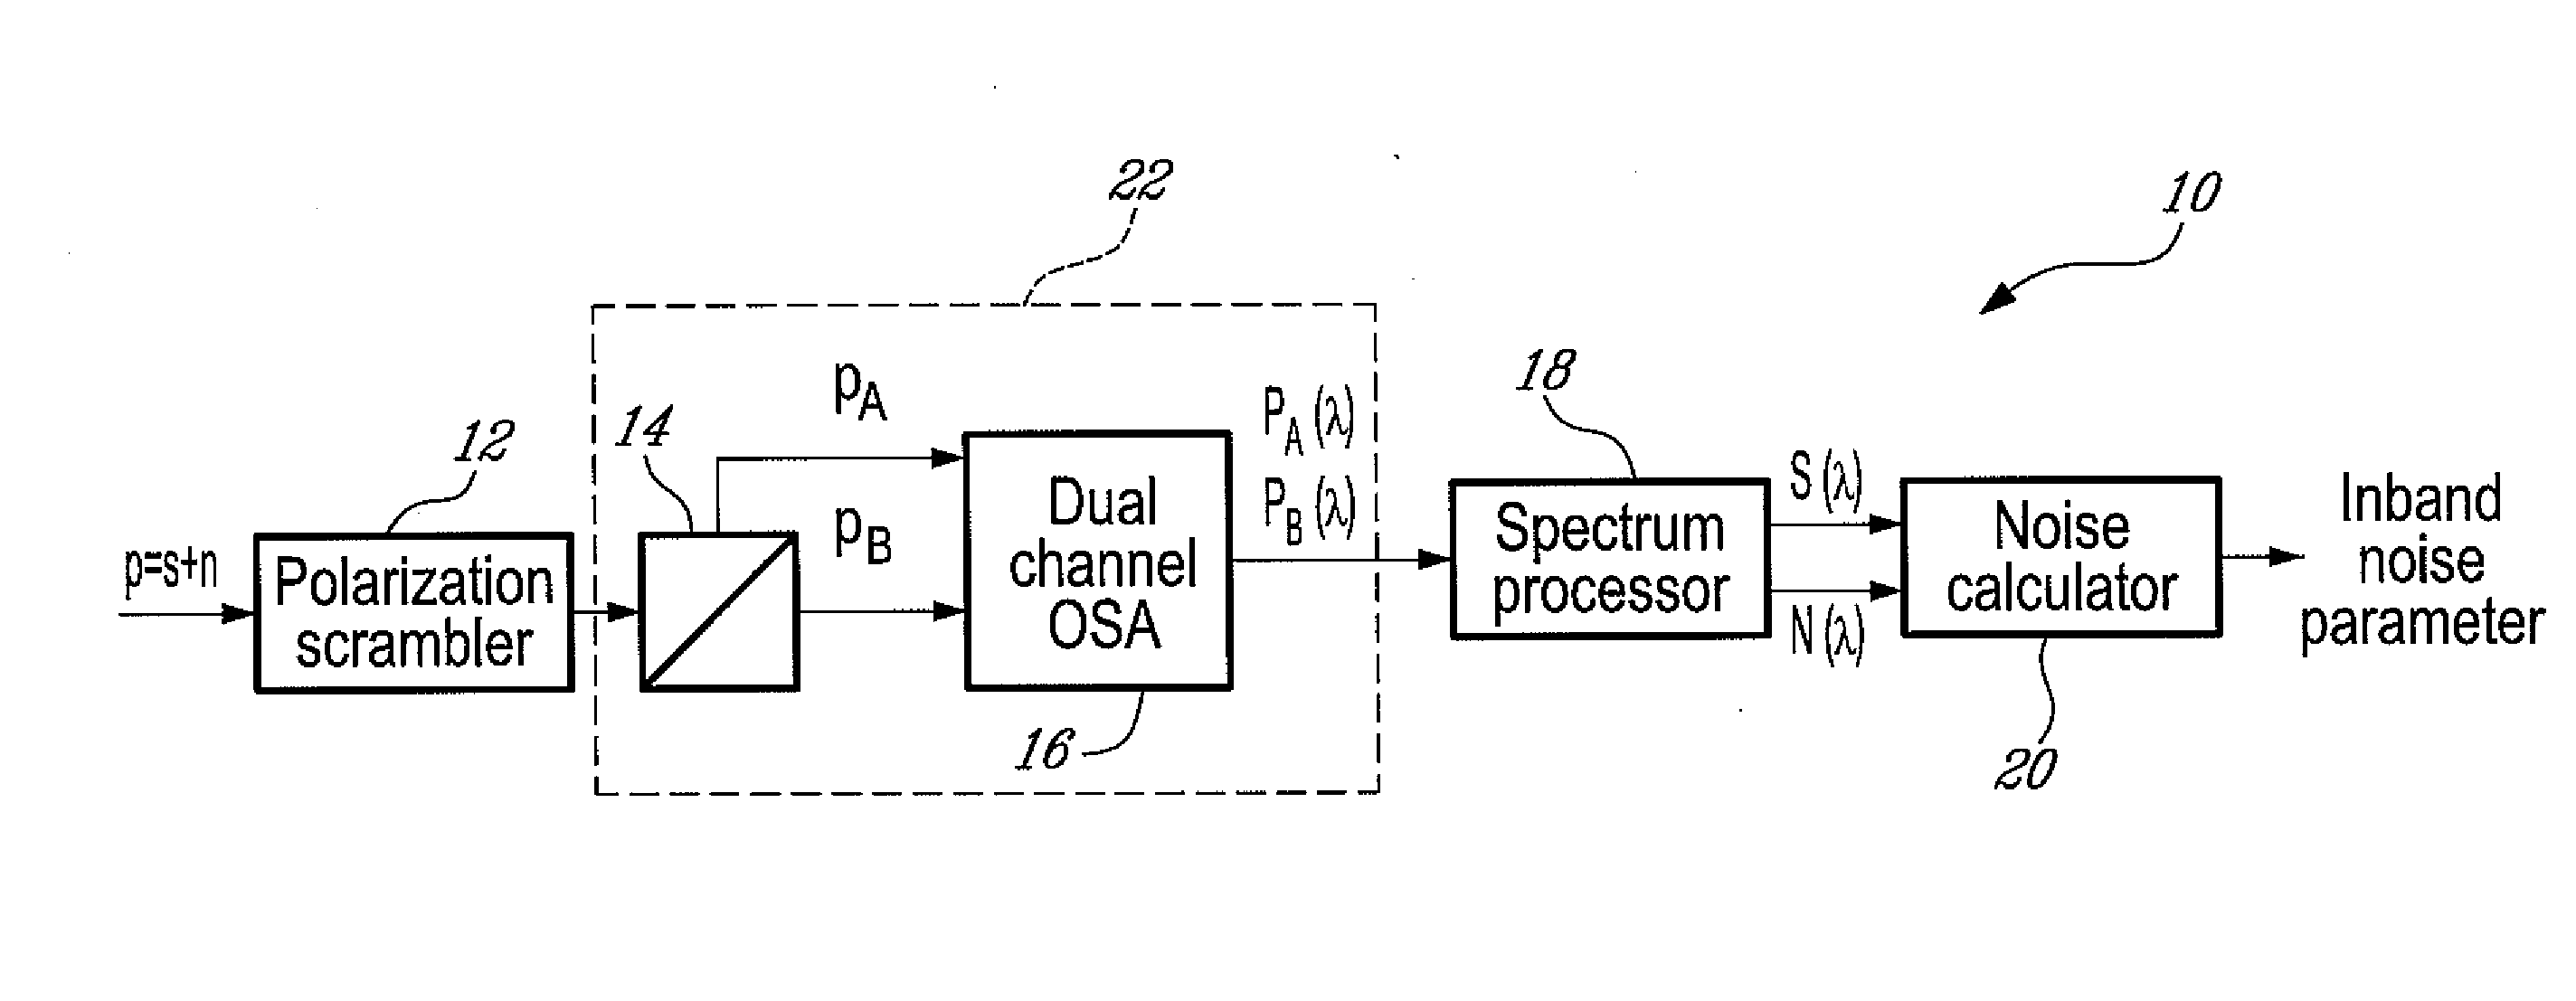
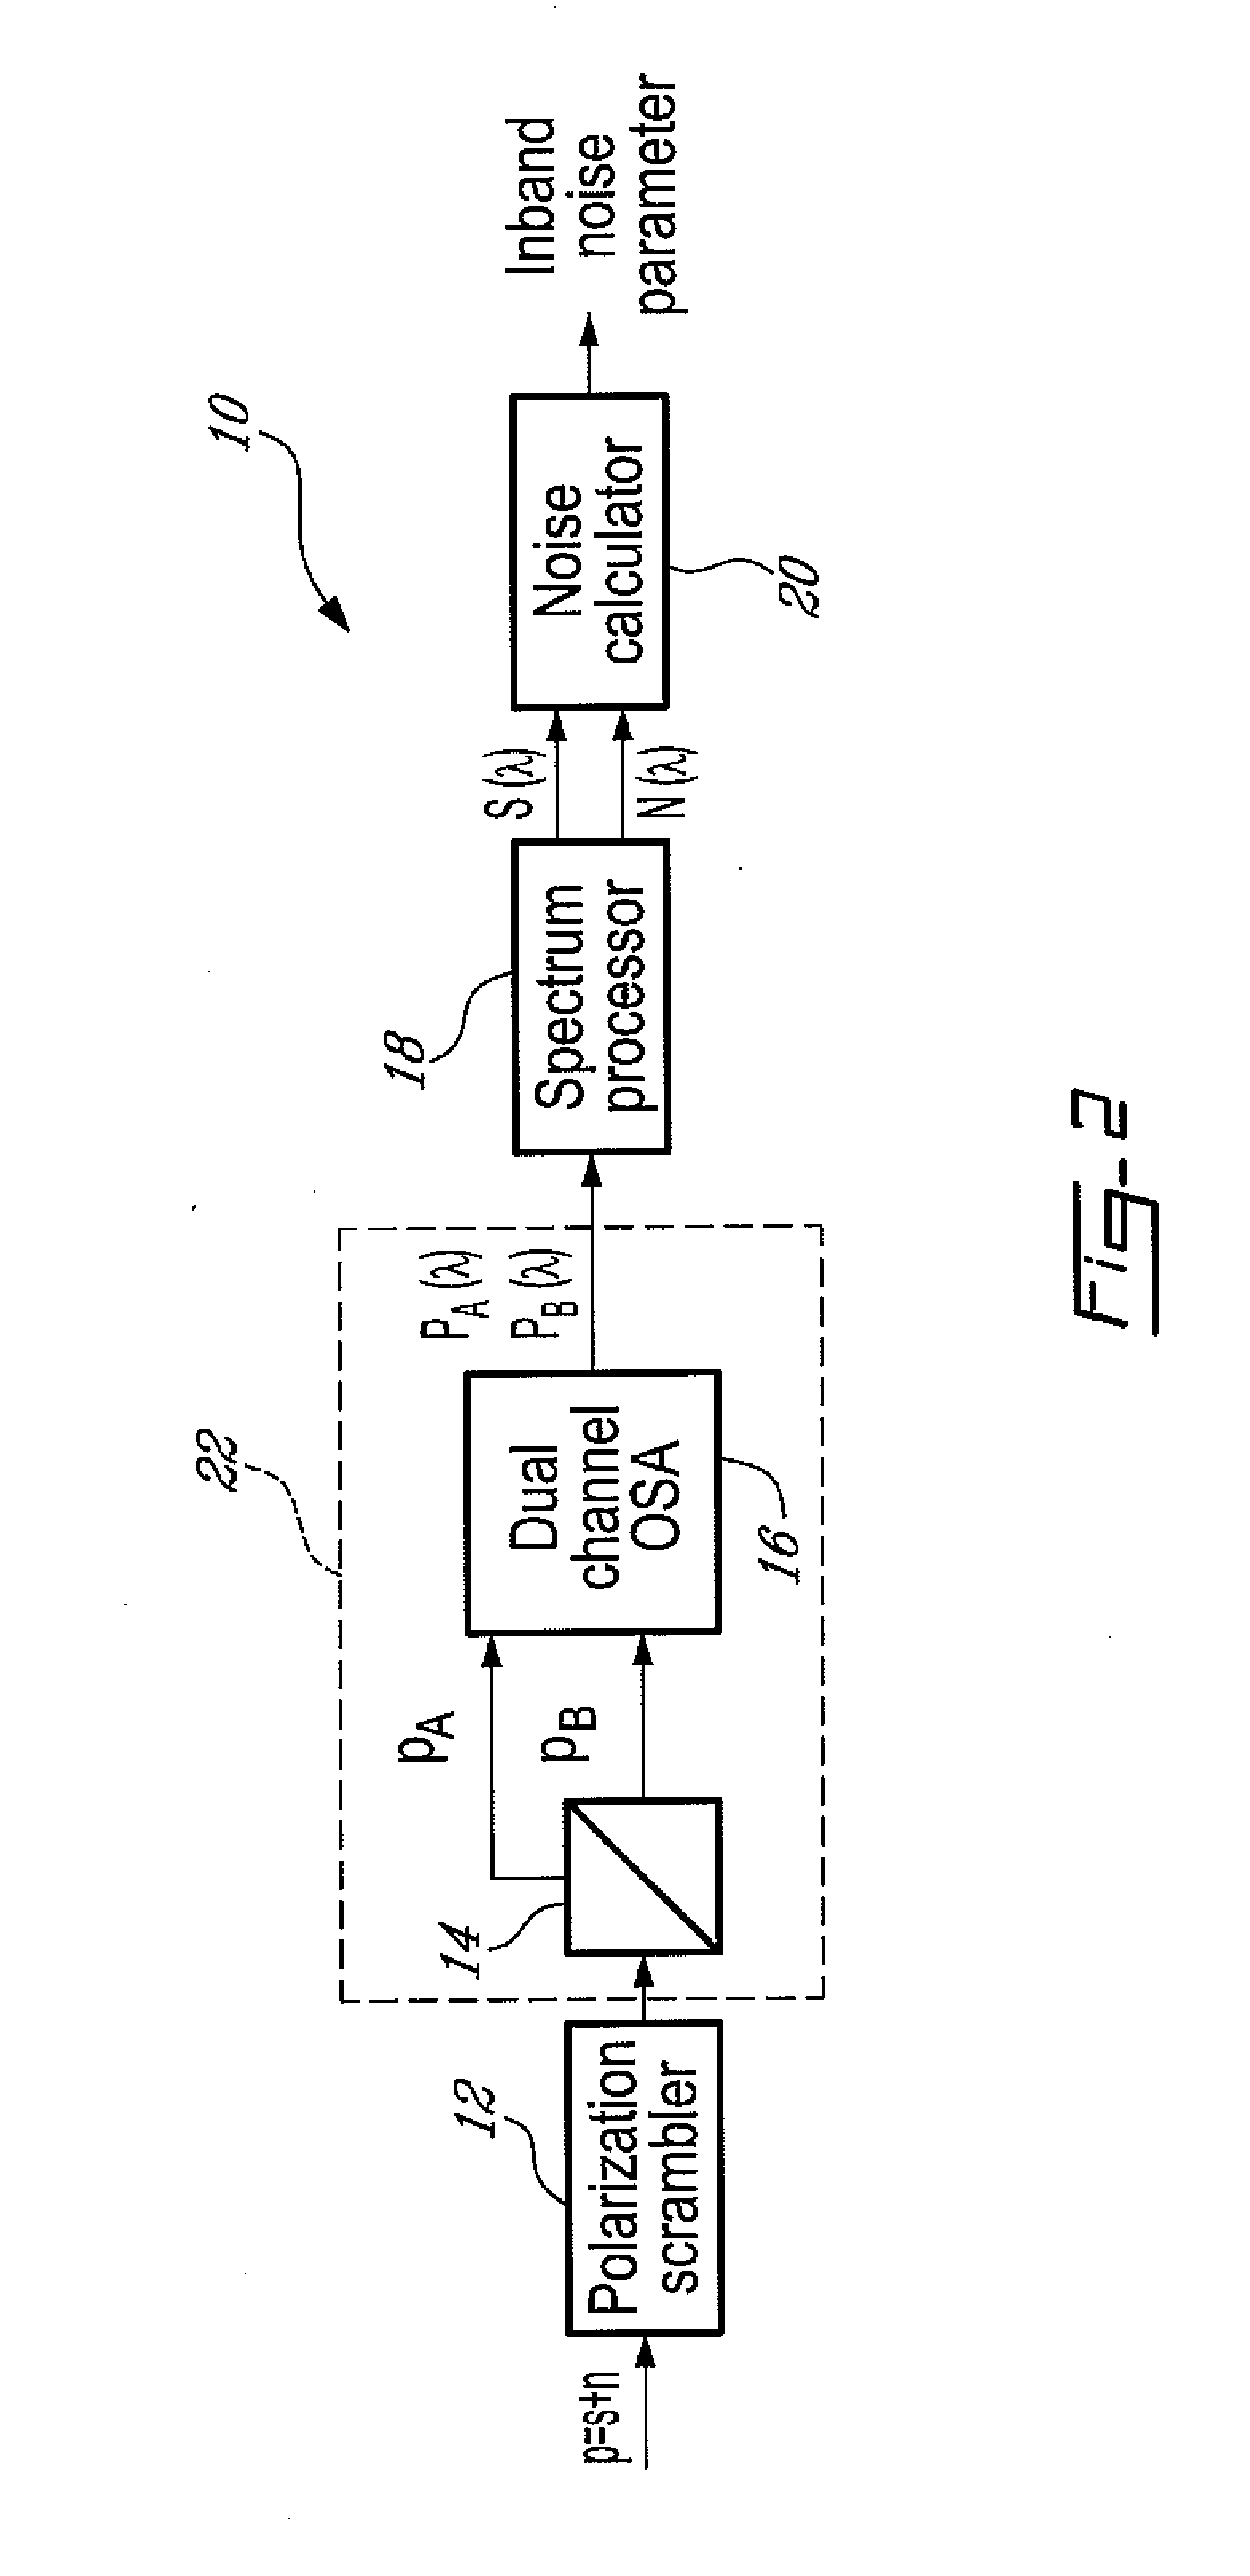
[0011]One alternative approach to both the interpolation method and the active polarization-nulling method, is more fully described in the specification of U.S. patent application Ser. No. 12 / 594,503 which is incorporated herein, the latter application commonly owned by the Applicant. One aspect described referred to as the Passive Polarization-Induced Discrimination (PPID) approach. The PPID approach involves the polarization-diverse detection of an optical spectrum with optical spectrum analyzer means, where two optical spectrum traces are acquired under different, and typically orthogonal, polarization analysis conditions. However, unlike the active polarization-nulling method where the ultimate OSNR that can be measured approximately corresponds to the maximum measured difference between spectrum traces taken under the orthogonal polarization analysis conditions, the ultimate OSNR that can be measured with the PPID approach can be significantly greater than this maximum measured difference. In other words, the PPID approach does not require at all that the polarized signal be suppressed or close to the electronic noise floor of the measurement instrument. This results in significantly less stringent requirements on the polarization control of the signal-under-test, the quality (e.g. polarization extinction ratio) of the OSA components, and the measurement time can be significantly reduced compared to the active polarization-nulling method.

Problems solved by technology

Increased modulation rates, which enlarge the signal bandwidth, and increased channel density, reduce the interchannel width; therefore resulting in severe spectral characteristics requirements for the optical spectrum analyzers used to perform the measurement.
The interpolation of the interchannel noise level then becomes unreliable.
However, increased modulation rates combined with narrow filtering of multiplexers and demultiplexers is making it increasingly difficult to achieve a reliable measurement of the noise level within the channel bandwidth.
This high degree of extinction imposes constraints on the instrumental noise floor that normally is often limited by the electronics, quality of the polarization-diversity optics, etc., which, in order to be satisfactorily overcome, requires increasing the inherent cost of the instrument.
Notwithstanding the aforementioned instrumental constraints, attainment of such a high extinction ratio also requires either an excellent coverage of the States-Of-Polarization (SOPs) on the Poincaré sphere, i.e. the generation of a very large number of SOPs or the use of a full “high-end”, i.e. very accurately calibrated, and hence costly polarimetric OSA.
It is noted however that the limiting noise source in most optically-filtered long-haul optical networks is the signal-ASE beat noise, in which the signal and the ASE interfere at baseband frequencies within the electronic detection bandwidth.
Not only are the associated optical spectra of the modulated signals much wider than previous (generally on-off-keying) 10 Gb / s systems, but the spectral profiles are often more complicated, and not necessarily “sharply peaked” at the center.
Accordingly, OSNR of such systems can not be determined reliably based on an estimation of the underlying in-band noise assuming a flat optical noise spectral trace.
Using an iterative calculation, the noise level trace may be estimated in-band at wavelengths closer to the signal peak, but the error on the estimated noise level increases as the signal component increases near the signal peak.
In these system, not only are the associated optical spectra of the modulated signals much wider than previous on-off-keying 10 Gb / s systems, but the spectral profiles are often more complicated, and not necessarily sharply peaked at the center.
Accordingly, OSNR of such systems can not be determined reliably based on an estimation of the underlying in-band noise assuming a flat optical noise spectral trace.
Moreover, perturbations to the noise spectral trace, notably due to crosstalk from closely-spaced neighboring channels, may render even more unreliable OSNR determinations predicated such an estimation.

Method used


Image

  • In-band optical noise measurement using differential polarization response
  • In-band optical noise measurement using differential polarization response
  • In-band optical noise measurement using differential polarization response

Examples


Embodiment Construction

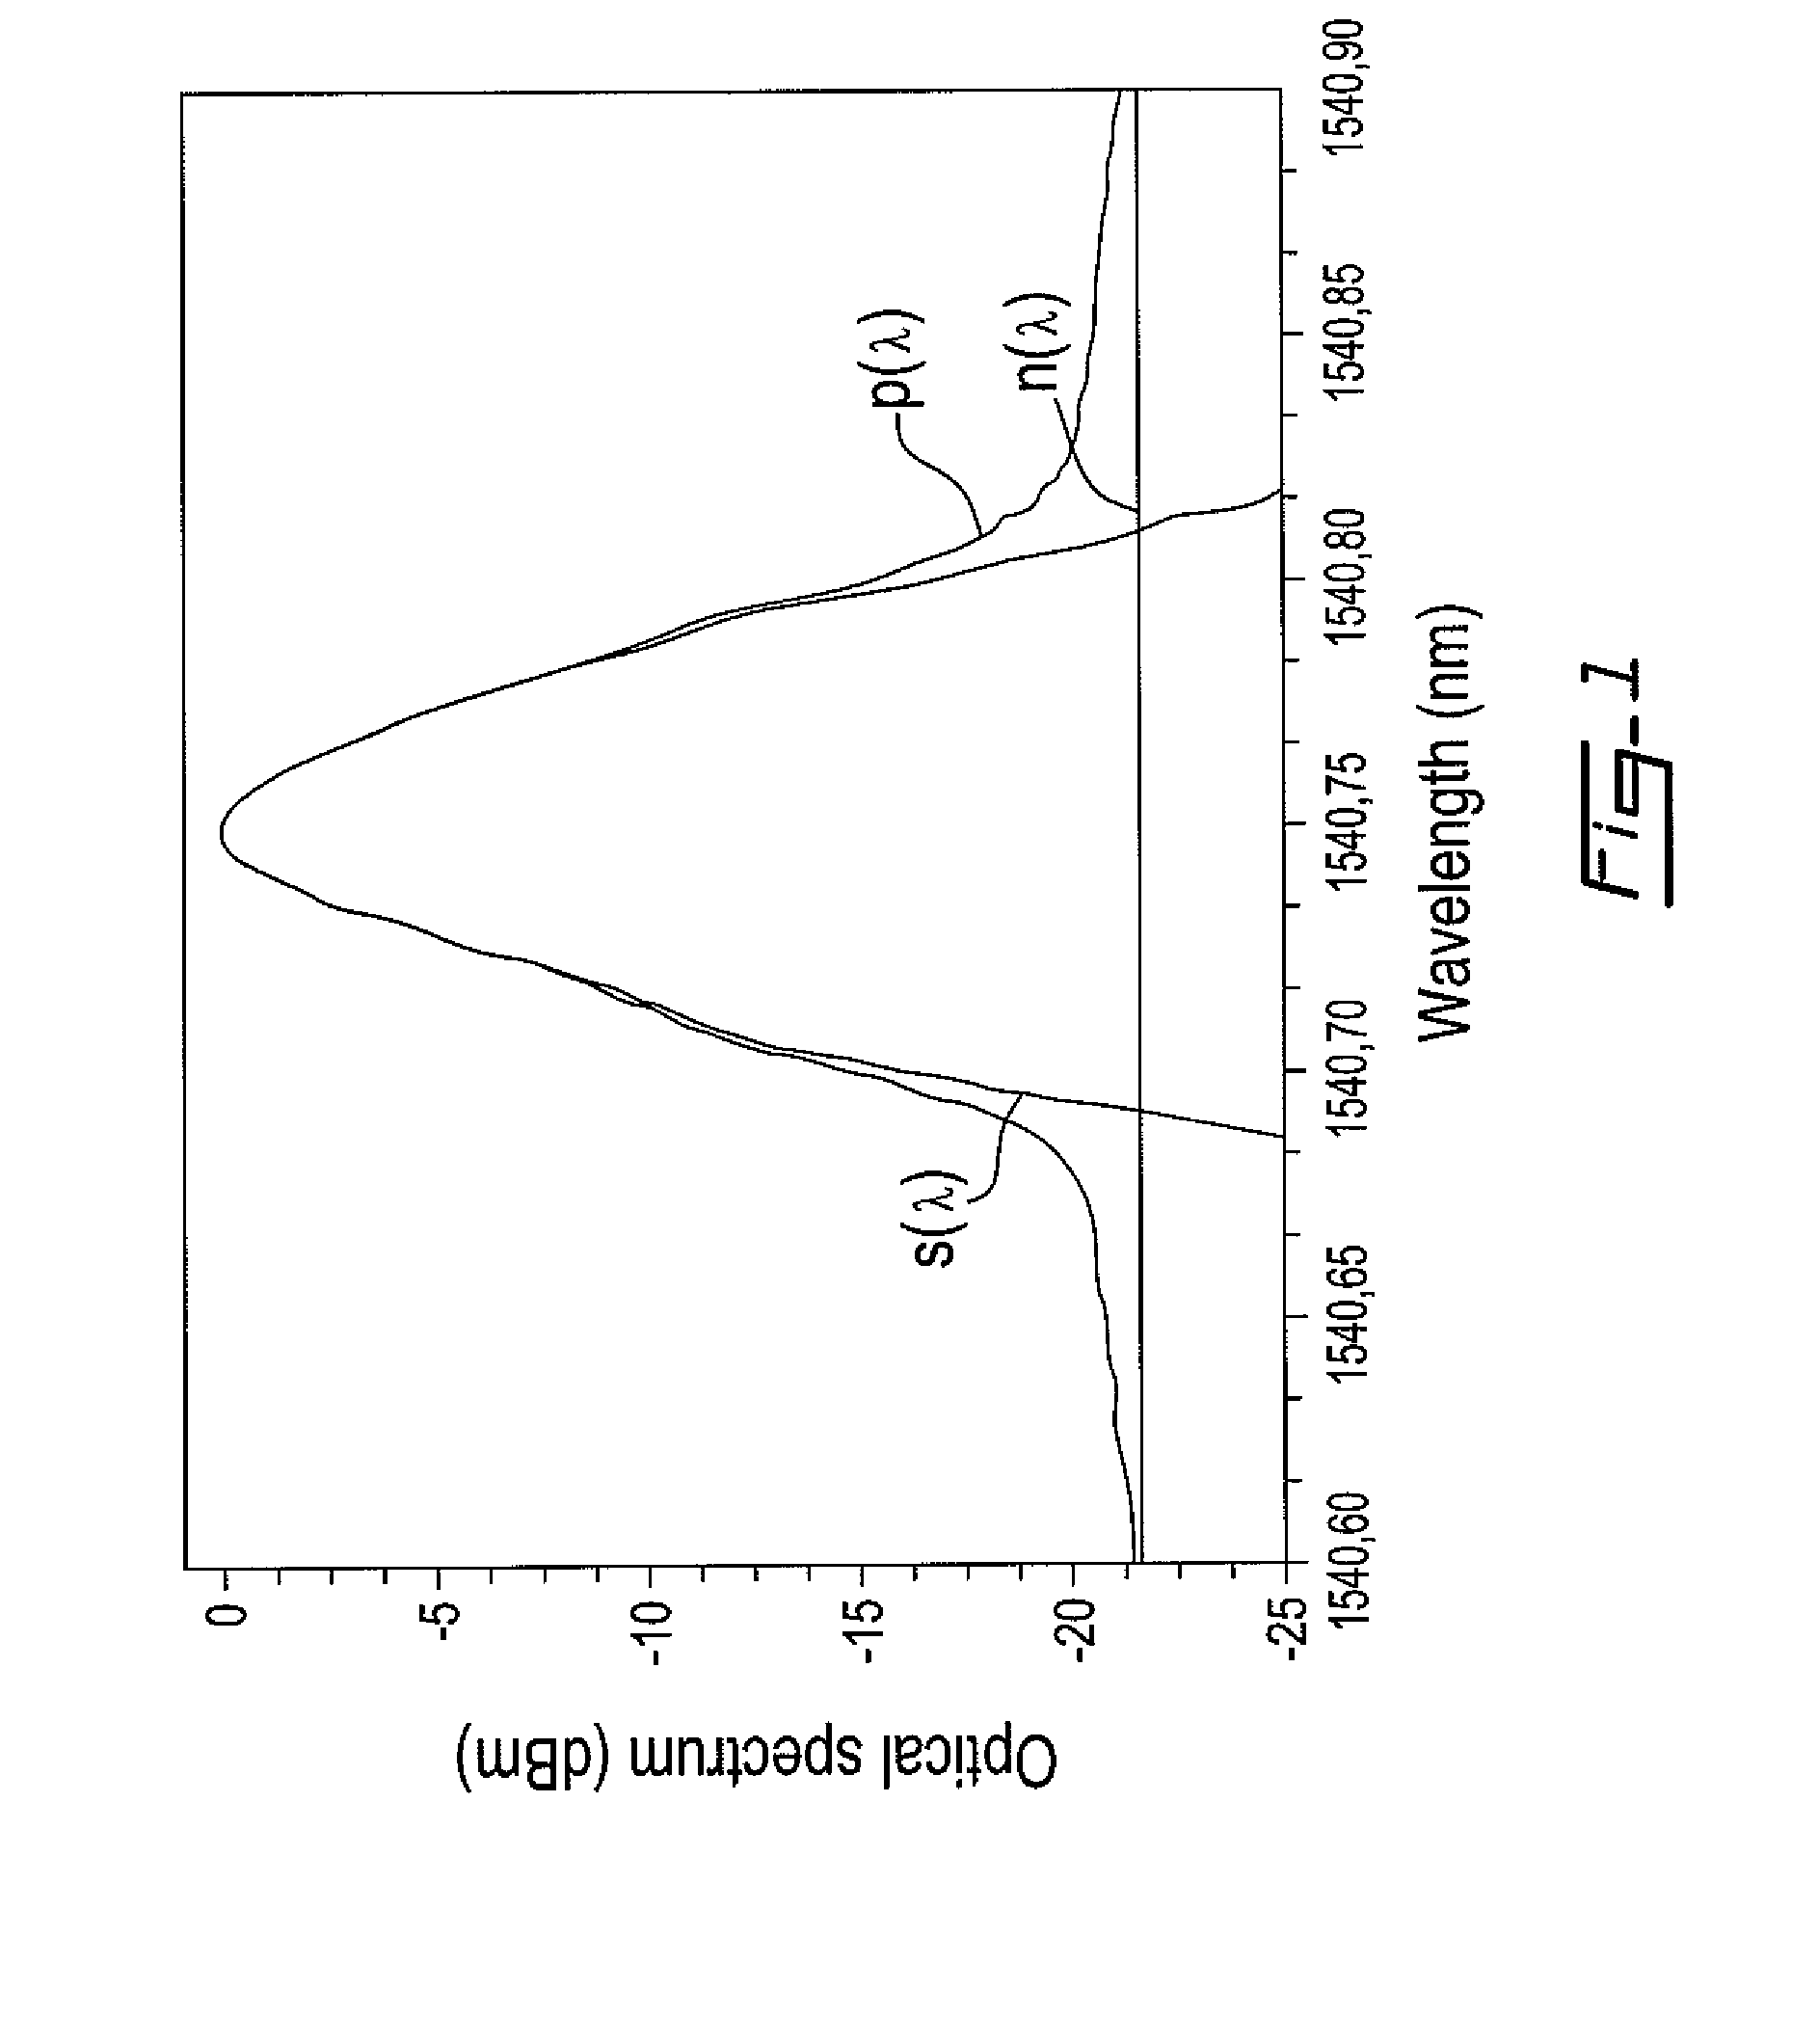
[0041]Now referring to FIG. 1, the methods and systems described herein relate to the characterization of an optical signal p which is used in optical telecommunications to transmit data over a Dense Wavelength Division Multiplexing (DWDM) optical channel. Throughout the present description, the optical signal p corresponds to one of the DWDM optical channels. In the optical channel bandwidth of interest, the optical signal p includes two components, i.e. a signal contribution s arising from the data-carrying signal, and a noise contribution n which includes all other sources of optical power within the optical channel. The noise contribution n arises mostly from the Amplified Spontaneous Emission (ASE) noise of the optical amplifiers in the optical transmission system. FIG. 1 shows the optical spectrum p(λ) of an example optical signal p, along with the optical spectrum of its signal contribution s(λ) and the optical spectrum of its noise contribution n(λ), such that:

p(λ)=s(λ)+n(λ)...


PUM


Abstract

A method comprises: acquiring, for a number nSOP of varied State-Of-Polarization analysis conditions of the input optical signal, nSOP polarization-analyzed optical spectrum traces; mathematically discriminating said signal contribution from said noise contribution within said optical signal bandwidth using said polarization-analyzed optical spectrum traces, said mathematically discriminating comprising: obtaining a differential polarization response that is related to the optical spectrum of said signal contribution by a constant of proportionality; estimating the constant of proportionality of a differential polarization response to the optical spectrum of said signal contribution; estimating the optical spectrum of said noise contribution from said input optical signal, within said optical signal bandwidth using said constant of proportionality and said differential polarization response; and determining said in-band noise parameter on said input optical signal from the mathematically discriminated noise contribution.

Description

CROSS-REFERENCE TO RELATED APPLICATIONS[0001]This application is a continuation-in-part of U.S. patent application Ser. No. 12 / 594,503 which international filing date is Apr. 4, 2008, now pending, and which claims priority under 35USC§119(e) of U.S. provisional patent application 60 / 910,352 filed Apr. 5, 2007; the specifications of which are hereby incorporated by reference. This application also claims priority under 35USC§119(e) of U.S. provisional patent application 61 / 235,169 filed Aug. 19, 2009, the specification of which being hereby incorporated by reference.TECHNICAL FIELD[0002]The invention relates to the determination of the in-band noise in optical telecommunication applications. More specifically, the invention relates to the determination of the in-band noise in Dense Wavelength Division Multiplexing (DWDM) optical networks.BACKGROUND OF THE ART[0003]The Optical Signal-to-Noise Ratio (OSNR) is a direct measure of the quality of signal carried by an optical telecommunica...

Claims


Application Information

Patent Timeline
Patent Type & Authority Applications(United States)
IPC IPC(8): H04B10/08
CPCH04B10/07953
Inventor HE, GANGCYR, NORMANDGARIEPY, DANIEL
Owner EXFO
Learn More