Method of correcting reflectivity measurements and radar implementing this method

a reflectivity measurement and radar technology, applied in the direction of instruments, measurement devices, climate sustainability, etc., can solve the problems of non-uniformity, difficult to correct, and undetectable atmospheric gases

Inactive Publication Date: 2012-05-31
THALES SA
View PDF15 Cites 47 Cited by
  • Summary
  • Abstract
  • Description
  • Claims
  • Application Information

AI Technical Summary

Benefits of technology

[0036]The pressure field is estimated, for example, using a decreasing function of the pressure with the altitude of the standard atmosphere.

Problems solved by technology

These components are mainly cloud droplets, atmospheric gases and the effects due to the non-uniformity of filling of the radar resolution volume.
Atmospheric gases are also undetectable by a radar and contribute to the attenuation of electromagnetic waves and therefore attenuation of the radar signal.
It is very difficult to correct it as what is measured remains a value smooth over a resolution volume.
It may therefore be seen that this non-uniformity becomes a problem for observations at moderate and large distances.
Thus, a hazard associated with an observed precipitating system may be underestimated, in particular when the radar operates in the X band and at higher frequencies.
However, such technique is not free of ambiguity in the measurements, such as those associated with the confusion between non-Rayleigh effects and the attenuation.
Furthermore, it is difficult to implement this technique for airborne radars that operate at a single frequency, especially for space requirement reasons.
This mechanism is technically sophisticated, and even less realistic as regards airborne radars.
Thus, at the present time, in the context of radars operating at a single frequency, such as for example airborne radars, there is no exploitable method for correcting the attenuation of microwaves due to cloud droplets.

Method used


Image

  • Method of correcting reflectivity measurements and radar implementing this method
  • Method of correcting reflectivity measurements and radar implementing this method
  • Method of correcting reflectivity measurements and radar implementing this method

Examples


Embodiment Construction

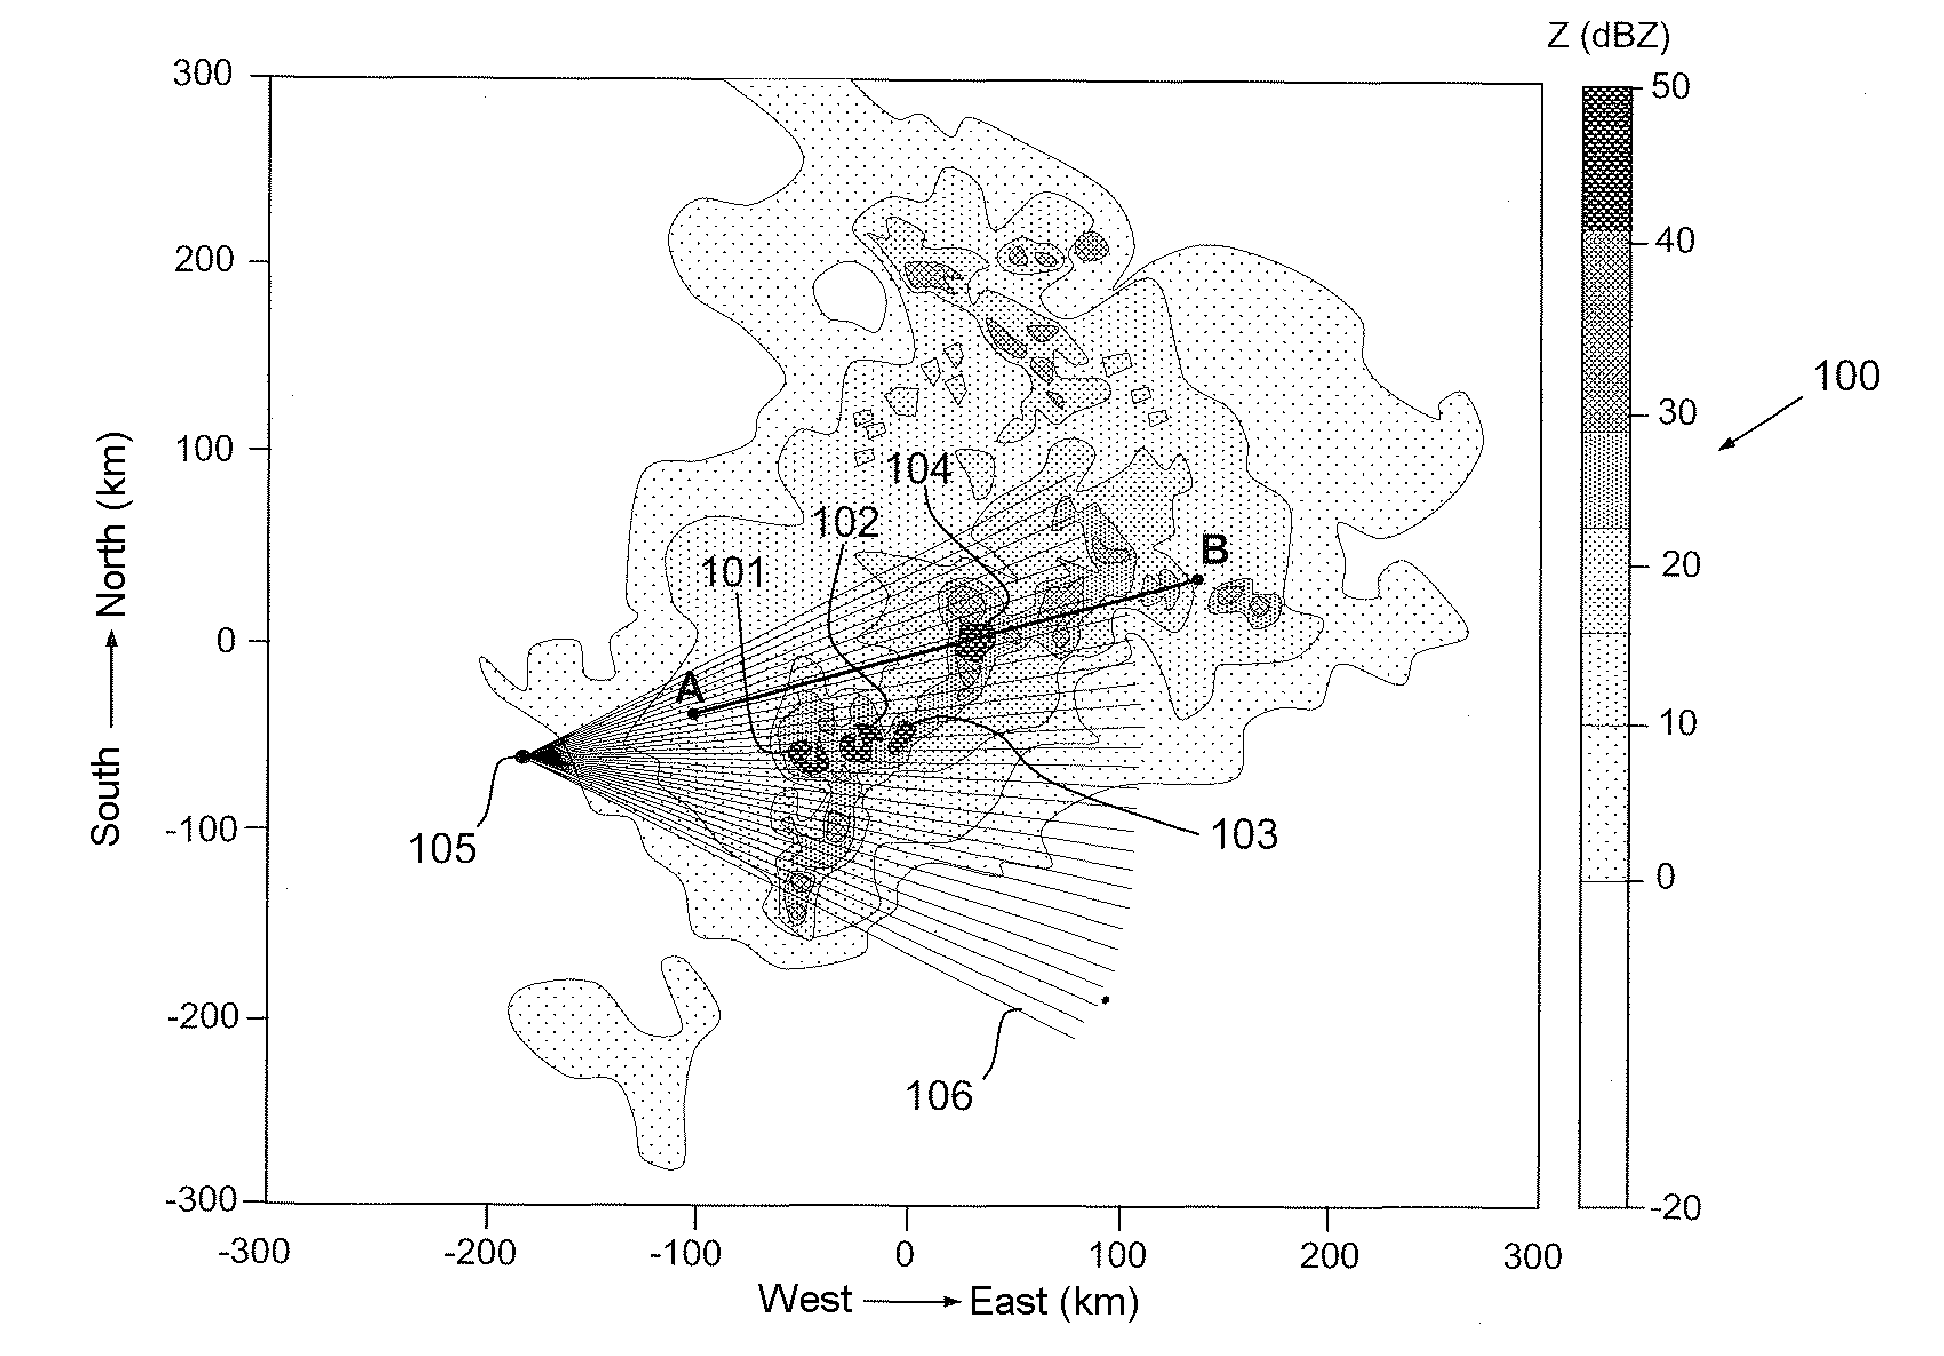
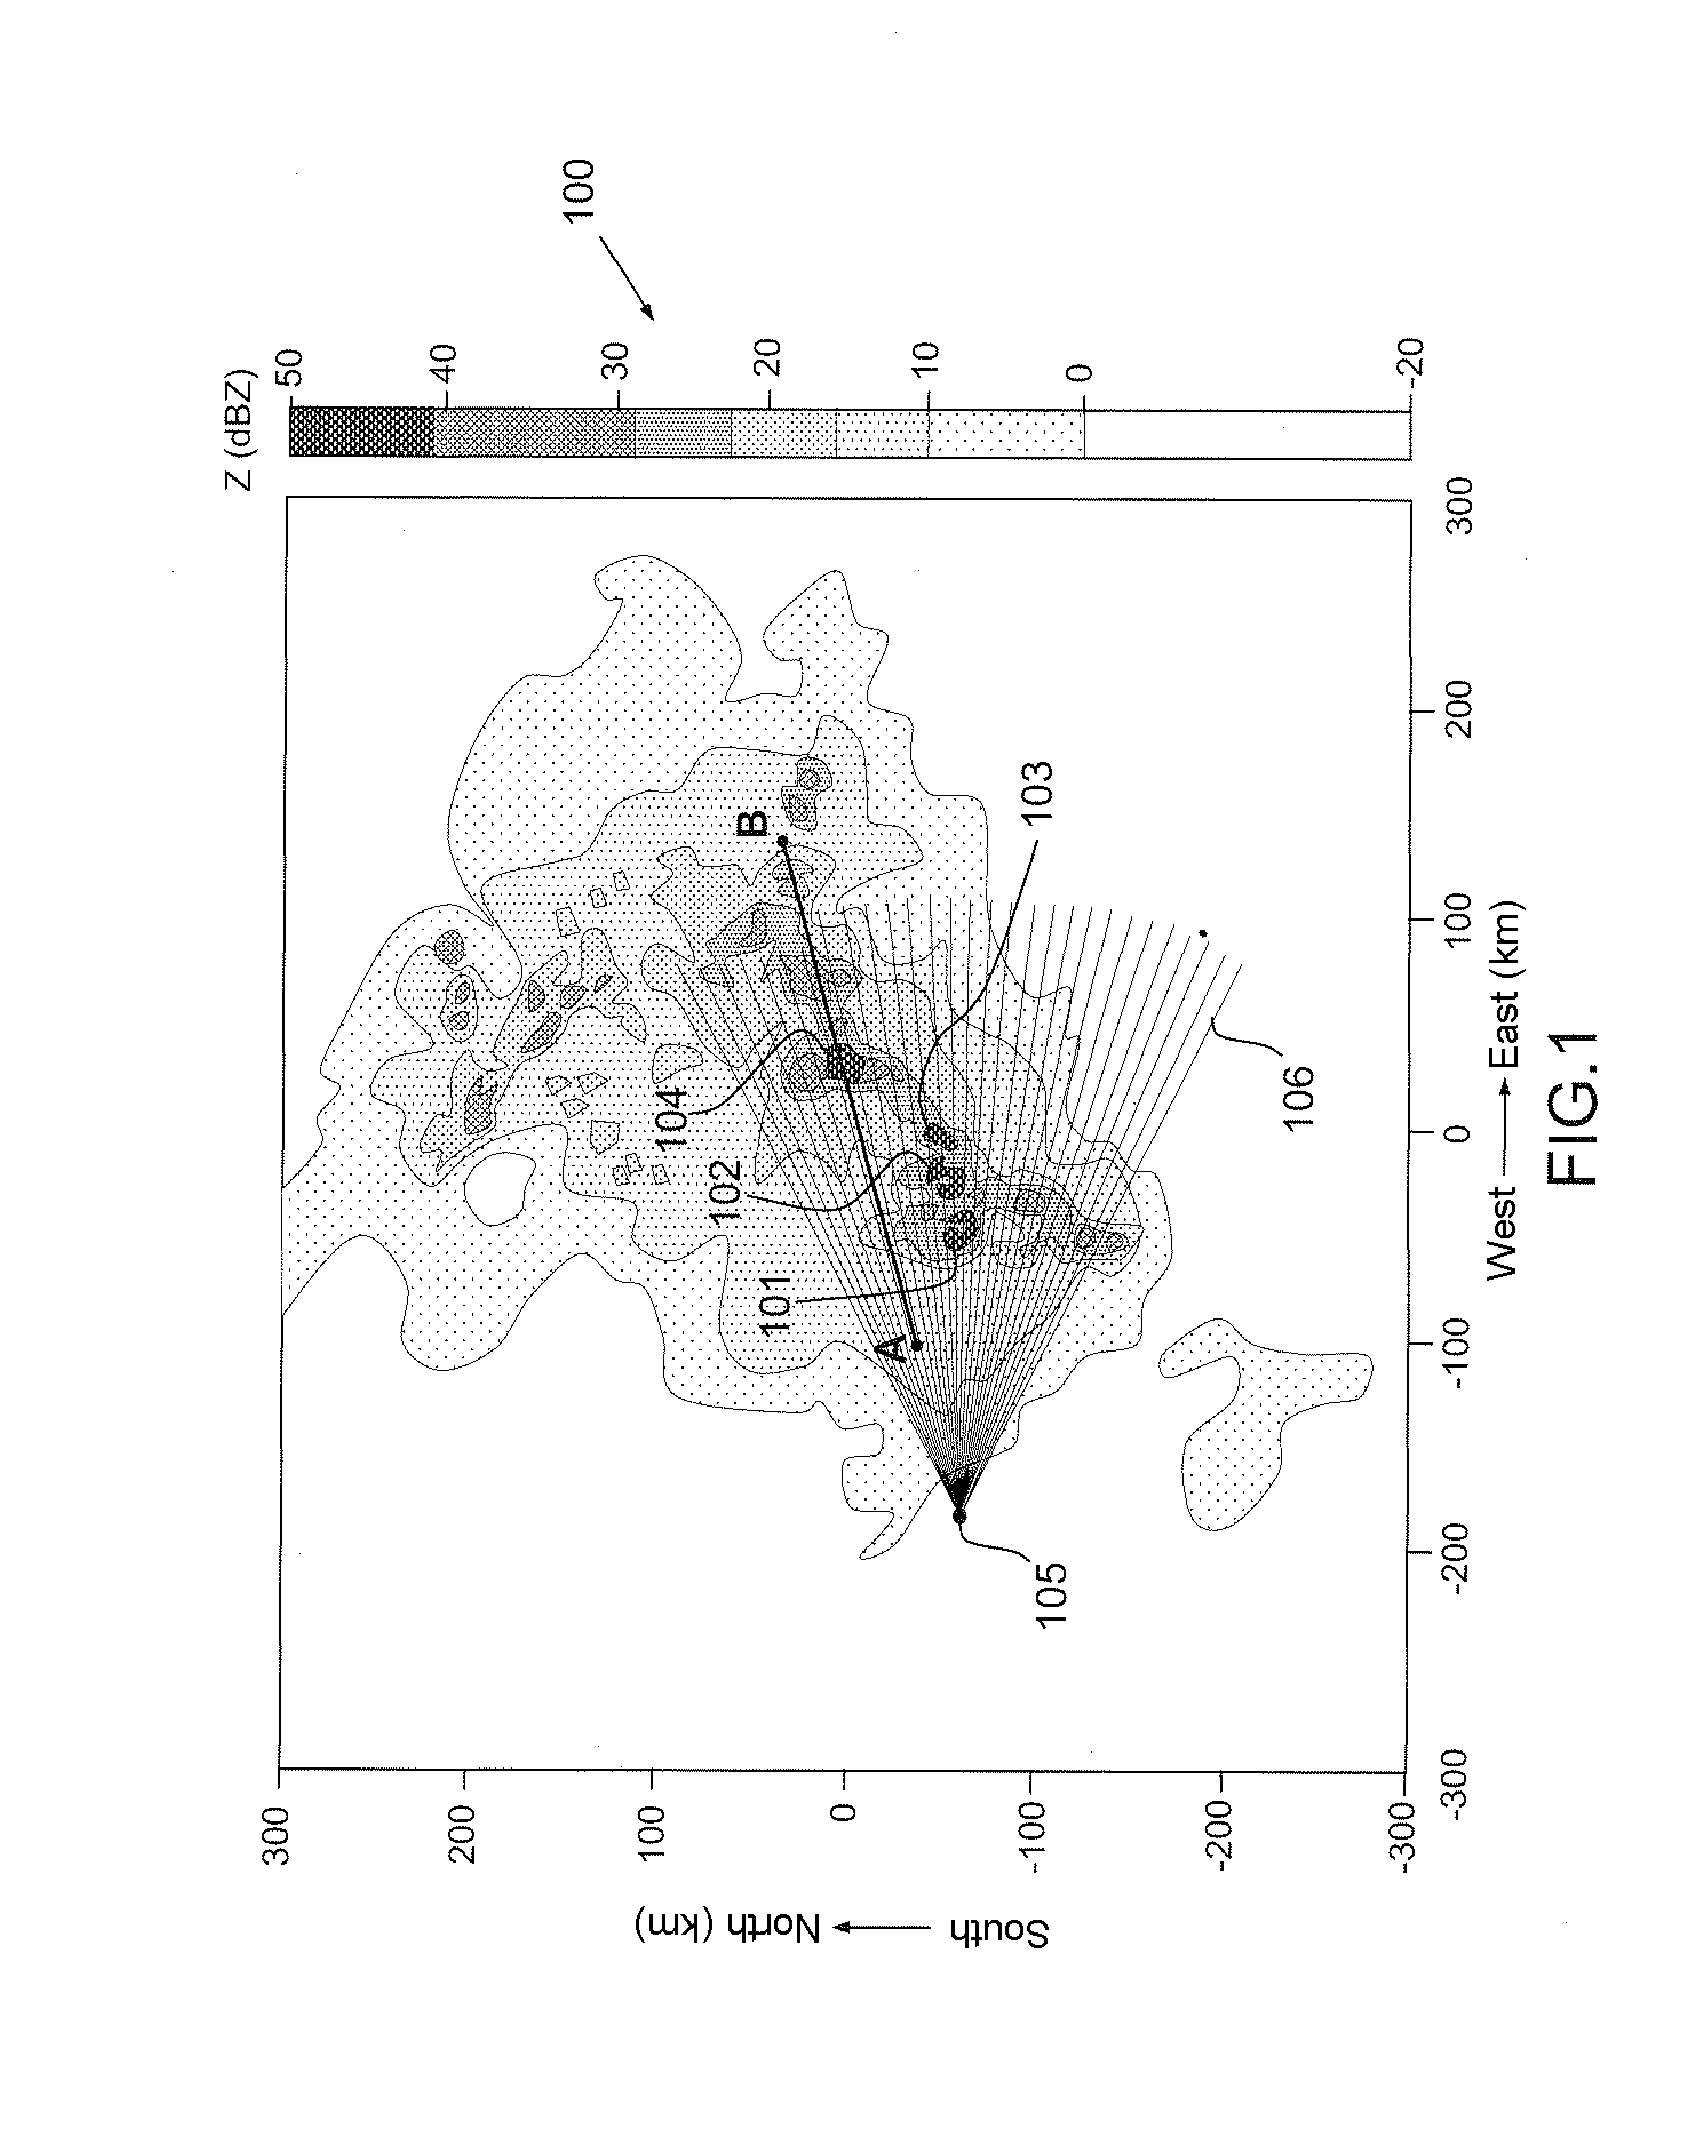
[0055]FIG. 1 gives an example of an S band (f=3 GHz) radar image of a squall line extending over around 200 km. A radar image is made up of pixels, each of them being associated with a resolution volume with which a radar measurement is associated. These pixels are usually colored, and their color corresponds for example to a reflectivity level. The colored radar image generated thus makes it possible for the presence of precipitation to be visually discerned. Since FIG. 1 is in black and white, the reflectivity level is not shown in color but according to a gray scale 100, the principle remaining the same.

[0056]The S band is hardly attenuated so that it constitutes a good reference. The presence of convective cells 101, 102, 103, 104 of high reflectivity, greater than 40 dBZ, indicates the possible presence of hail and therefore attests to the hazardousness of this system. An X band radar 105 is positioned on the image. A line 106 corresponds to a radial line, i.e. a line in a dire...


PUM


Abstract

A method of correcting reflectivity measurements performed by a radar, such as a weather radar, includes a reflectivity measurement being associated with a resolution volume. The method includes acquiring the reflectivity measurement Zm corresponding to the current resolution volume, estimating the attenuation kc introduced by the cloud droplets, said estimating being carried out by using an average vertical profile of the cloud liquid water content, estimating the attenuation kg,O2 introduced by dioxygen, estimating the attenuation kg,H2O introduced by the water vapor, determining the total specific attenuation k of the non-detectable components taking into account the attenuation kc, the attenuation kg,O2 and the attenuation kg,H2O estimated in the preceding steps, and correcting the measured reflectivity taking into account the estimated total specific attenuation k. The method may be implemented by an onboard weather radar.

Description

CROSS-REFERENCE TO RELATED APPLICATIONS[0001]This application claims priority to foreign French patent application No. FR 10 02272, filed on May 28, 2010, the contents of which are incorporated in their entirety herein by reference.FIELD OF THE INVENTION[0002]The invention relates to a method of correcting reflectivity measurements and to a radar implementing this method. It applies notably to the field of weather radars onboard aircraft, such as for example radars operating in the X band, i.e. the frequency (f) within which being close to 10 GHz. However, the invention is applicable at other frequencies.BACKGROUND OF THE INVENTION[0003]A weather radar transmits pulses of very short duration followed by listening time. The position and intensity of precipitation is estimated by analyzing the echoes of these pulses. This analysis is carried out, for example, on the basis of a measurement of the reflectivity level over the resolution volume of the radar.[0004]There are components that...

Claims


Application Information

Patent Timeline
Patent Type & Authority Applications(United States)
IPC IPC(8): G01S13/95
CPCG01S7/411G01S13/958G01S13/953Y02A90/10
Inventor PUJOL, OLIVIERCOSTES, CLEMENTINEARTIS, JEAN-PAULMESNARD, FREDERICSAUVAGEOT, HENRIIASSAMEN, ALIA
Owner THALES SA
Why Eureka
Try Eureka